3.3.7 Economics β€” section quiz

Unit 3 Β· Culture Β· Lesson 3.3 Economics

The big idea Every economy answers one question: who decides what gets made, and who gets it β€” individuals and the market (free-market), the government (command), tradition (traditional), or some mix of all three (mixed, which is almost every real country). Once you can sort an economy into that frame, the rest of the unit β€” development, HDI, the green revolution β€” is about measuring how well an economy is actually serving the people living in it.

By the end you can

  • Identify and compare command, market, traditional, and mixed economic systems.
  • Evaluate world trade and world economic inequality.
  • Analyze the gaps between developed and undeveloped countries.
  • Describe the agricultural revolution and its consequences.

Before you start: who decides, and how do we measure if it's working

This unit has two separate halves that can blur together β€” economic systems (who decides what gets made) and development measurements (how well is it working for people). Keeping them separate makes everything else click faster.

Not sure about the basics underneath this lesson?

Four economic systems

Production (making goods and services) and consumption (using them) are the two basic economic activities. How a society organizes that production is its economic system.

Four economic systems (2)

Free-market system: producers and consumers freely decide what to buy, sell, and produce, driven by supply and demand. Government's role is limited to enforcing fair play β€” stopping theft and fraud, protecting property, guaranteeing competition.

Four economic systems (3)

Command economy: the government decides what and how much gets produced, sets prices and wages, and owns most property, aiming for equality and security rather than leaving outcomes to the market. Socialist and Communist systems tend to run command economies.

Four economic systems (4)

Mixed economy: combines free choice and government intervention β€” which describes almost every real country, including the United States.

A customer in a cafΓ© handing cash to a server β€” an everyday free-market exchange
A free-market exchange: individuals freely deciding what to buy and sell. Contrast this with a command economy, where the government directs production.
Likely on the quiz If a question describes a government deciding prices, wages, and output, that's a command economy, not a free market β€” even if the country also has some private businesses (which would make it a mixed economy overall).

Traditional economies

A traditional economy is based on hunting, gathering, growing food, and herding animals β€” often using bartering rather than money, with low task specialization. The course's own description: this system fosters strong community and provides real security against unemployment and crime, but doesn't encourage economic growth or improve standard of living the way market or command systems can.

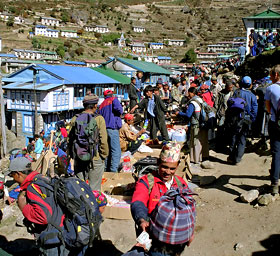
A crowded outdoor market in the mountains of Nepal with vendors and buyers exchanging goods directly
A bartering market in the mountains of Nepal β€” the course's own photo of a traditional economy still functioning today.
Likely on the quiz Traditional economy β‰  poor or backward by definition β€” the course specifically credits it with stronger community and security, while naming its real tradeoff: little economic growth.

The three (or four) sectors of the economy

Primary sector: raw materials extracted from nature β€” farming, fishing, mining (cotton grown on a Texas farm). Secondary sector: raw materials turned into products (cotton cloth sewn into garments). Tertiary sector: services that deliver the finished product to consumers (the clothing sold in a retail store). Some economists add a quaternary sector β€” the knowledge-based slice of tertiary work: information technology, consulting, research, financial planning.
HDI combines health, knowledge, and income per person.
A reference for separating development outcomes from total economic output.
Likely on the quiz Trace the cotton example in order: grown (primary) β†’ sewn into a garment (secondary) β†’ sold in a store (tertiary). Match any scenario to that same chain.

How sector balance shifts with development

The course's own four-country table makes the pattern concrete. As GDP per capita rises, the share of the economy in the primary sector shrinks and the share in the tertiary sector grows:

How sector balance shifts with development (2)

β€’ United States: 1.2% primary, 22.1% secondary, 76.7% tertiary β€” GDP per capita $48,100, poverty 15%.
β€’ Romania: 12.3% primary, 37.8% secondary, 50% tertiary β€” GDP per capita $12,300, poverty 25%.
β€’ India: 18.1% primary, 26.3% secondary, 55.6% tertiary β€” GDP per capita $3,700, poverty 25%.
β€’ Liberia: 76.9% primary, 5.4% secondary, 17.7% tertiary β€” GDP per capita $400, poverty 80%.

How sector balance shifts with development (3)

Liberia's economy is overwhelmingly agricultural (primary); the U.S. economy is overwhelmingly services (tertiary). Romania and India sit in between on every column.

HDI combines health, knowledge, and income per person.
A reference for separating development outcomes from total economic output.
Likely on the quiz If a question gives you a country's sector breakdown and asks you to guess its development level, a high primary-sector share points toward less developed, and a high tertiary-sector share points toward more developed.
Not sure about this bit?

No country is purely one system

Even in a free-market-leaning country, the government typically runs roads, public transit, public safety, the military, and universal education. The U.S. is a named exception on health care β€” older and some low-income Americans get government-funded coverage, but most insurance is private. China calls itself Communist, yet education and health care are mostly private there, and the government controls all broadcasting (compared with mostly private broadcasting, lightly regulated, in the U.S.). The lesson's point: nearly every real economy blends capitalism, Socialism, and Communism to some degree β€” pure versions are rare.

HDI combines health, knowledge, and income per person.
A reference for separating development outcomes from total economic output.
Likely on the quiz If a question asks you to name a "purely capitalist" or "purely Communist" country, the course's own answer is that almost none exist β€” look for the mixed-economy answer instead.

Culture and economics shape each other

Culture shapes economic activity β€” the course's own examples: the Thanksgiving-to-New-Year's season drives U.S. consumption of turkeys and gifts, and St. Patrick's Day drives green-themed products worldwide through cultural diffusion.

Culture and economics shape each other (2)

Economics also reshapes culture. A traditional economy changes slowly, with strong multi-generational continuity. Shifting to a command economy can disrupt that fast: China's industrialization has pulled a huge share of the population from country to city, created as many as 100 million migrant workers, and replaced the bicycle β€” once central to Chinese transportation β€” with the automobile, changing daily behavior along with it.

Culture and economics shape each other (3)

World economies are becoming more interdependent as communication and transportation improve and trade barriers fall. That flow of products, ideas, and lifestyles β€” often originating in the U.S. and Europe β€” is Westernization, and it draws real resistance from cultural leaders who see it as a threat to traditional, lower-consumption ways of life.

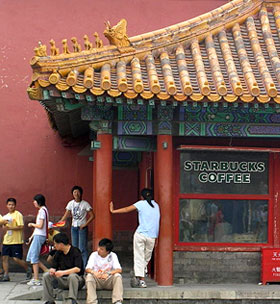
A Starbucks storefront tucked beneath traditional ornate red-and-gold Chinese temple roof architecture
A Starbucks inside Beijing's Forbidden City β€” the course's own image of Westernization meeting a very different cultural setting.
Likely on the quiz Westernization is specifically the spread of Western (U.S./European) culture and ideas β€” know it's named as controversial, not neutral, in the lesson.

Measuring quality of life

The course builds quality of life from four elements: health, wealth, wisdom (Benjamin Franklin's maxim), plus sanitation, which geographers add. Political stability β€” peaceful transitions of power, functioning institutions, rule of law β€” correlates with better outcomes on all of these: higher GDP, longer life expectancy, higher literacy, lower infant mortality.

HDI combines health, knowledge, and income per person.
A reference for separating development outcomes from total economic output.
Likely on the quiz If a question asks what geographers add to Franklin's "healthy, wealthy, and wise," the answer is sanitation.

The U.S. paradox: wealth in 2005, HDI rank in 2007

The course's own paradox, with two different years worth keeping straight: in 2005, the United States had the world's largest GDP ($12 trillion β€” about 20% of the entire world's GDP, from a country with only 5% of the world's population). Yet on the 2007 Human Development Index, the U.S. ranked just 12th, and separately ranked 45th in life expectancy. Wealth and overall quality of life aren't the same measurement β€” and these two data points come from two different years in the course's own source, not one single snapshot.

HDI combines health, knowledge, and income per person.
A reference for separating development outcomes from total economic output.
Likely on the quiz Keep the years separate if a question asks for them specifically: 2005 GDP figures, 2007 HDI ranking. Don't collapse them into one year.

Five ways to measure development

The course's own data table (comparing Iceland, Norway, Sweden, Japan, and the U.S.) tracks five measurements side by side: HDI, life expectancy, GDP per capita, Human Poverty Index (HPI), and Gender Empowerment Measure (GEM). The course states directly that for HPI, a high rating means lots of poverty β€” so a lower HPI score is better, the opposite direction from HDI or GEM. As supplementary background, UNDP’s GEM definition measures how much women participate in political and economic decision-making in a country β€” things like the share of parliamentary seats, management jobs, and income held by women.

Five ways to measure development (2)

Two specific figures from that table: Japan ranks very high on HDI (8th) and GDP per capita, but much lower on GEM (54th) β€” a reminder that a country can rank well on overall development while still ranking far lower on one specific measurement like gender empowerment.

HDI combines health, knowledge, and income per person.
A reference for separating development outcomes from total economic output.
Likely on the quiz HPI runs backwards from the others: high HPI = more poverty (bad), while high HDI, high GEM, and high GDP per capita are all good. Don't assume every index on this table points the same direction.
Not sure about this bit?

The Human Development Index and its limits

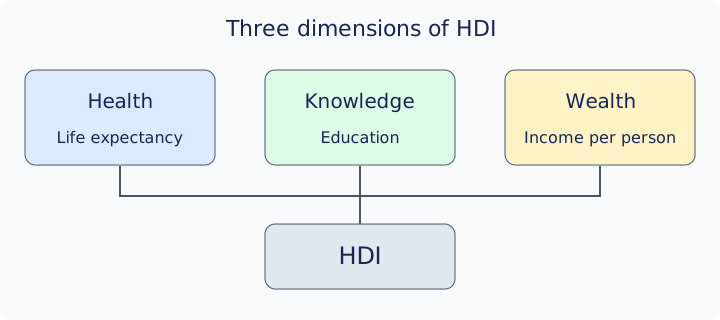
The Human Development Index (HDI), created in 1990, combines three measurements into one score: a long and healthy life (life expectancy), knowledge (literacy and school enrollment), and standard of living (per-capita GDP). It's widely used, but the course notes it leaves out sanitation, water availability, political freedom, and social stability.

The Human Development Index and its limits (2)

HDI sorts countries into developed (high standard of living, advanced economy), developing (low-to-medium standard of living, undeveloped infrastructure), and least developed (high poverty and economic dependence). Roughly by region, per the course: Australia, Europe, and North America are developed; Asia, Latin America, the Middle East, and northern Africa are developing; Central Africa is least developed. Wealth, energy consumption, and population size/growth rate are all correlated with HDI level β€” they share a connection and move together, though that's not the same as one directly causing another.

Health, knowledge, and income per person combine in the Human Development Index.
The three dimensions of HDI. HPI and GEM are separate measures.
Likely on the quiz HDI measures three things only β€” health, knowledge, wealth. If a question lists sanitation or political freedom as part of HDI, that's the trap; the course explicitly says HDI leaves those out. HPI and GEM are separate, additional measurements, not part of HDI itself.

Newly industrializing countries

A newly industrializing country (NIC) hasn't yet reached developed status but is growing rapidly through industrialization and improving technology, education, and infrastructure. The course's named NICs: Brazil, Russia, India, China, Mexico, and Turkey.

Newly industrializing countries (2)

Brazil is the course's worked example, with figures it states as current at the time it was written: the world's 9th-highest GDP, biggest economy in Latin America, HDI rank 63 (just behind Russia, ahead of China and India), 10th-largest energy consumer worldwide, 5th-largest population but a growth rate of only about 1%. The course is also clear that development has a cost: Brazil's life expectancy ranked only 84th worldwide by its figures, and nearly 20% of its population lived in poverty. These are the course's own stated rankings from when it was written, not necessarily Brazil's standing today β€” the teaching point (growth doesn't erase every problem at once) holds regardless of the exact current numbers.

HDI combines health, knowledge, and income per person.
A reference for separating development outcomes from total economic output.
Likely on the quiz Brazil shows that a country can be close to "developed" by several measures (GDP, HDI rank) while still trailing badly on others (life expectancy, poverty) β€” don't assume high GDP rank means uniformly high development on everything.

The green revolution and Malthus

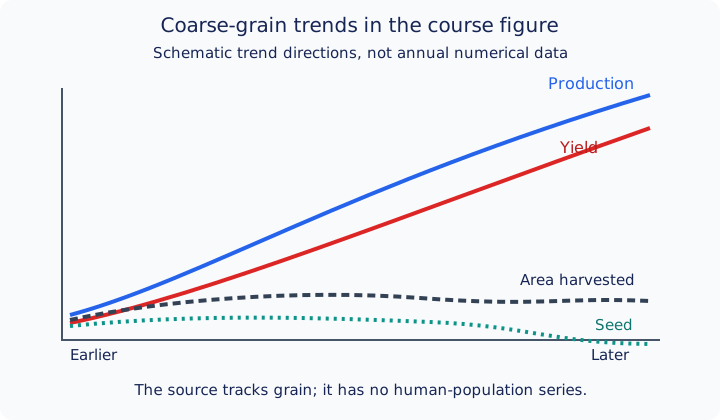
In 1798, economist Thomas Malthus predicted disaster: food production grows arithmetically (1, 2, 3, 4) while population grows geometrically (2, 4, 8, 16), so starvation, disease, or war were inevitable limits. His prediction hasn't come true β€” because of the green revolution, a surge in agricultural productivity from the 1940s through the 1960s driven by new fertilizers, plant varieties, and farming techniques. Crop yield rose even as land and seed inputs went down.

Schematic course trends: coarse-grain production and yield rise strongly, harvested area changes much less, and seed declines late. No human-population series is shown.
Qualitative schematic based on the course’s grain figure, not an annual data plot. Human population is a separate part of the Malthus argument.
Likely on the quiz Keep Malthus's two growth patterns straight: food = arithmetic (adding), population = geometric (multiplying). The green revolution is why his gloomy prediction hasn't come true β€” so far.

The five agricultural technologies behind the green revolution

Use these general descriptions to review the five technologies named by the study sheet. Check the course's farm-scene activity or your notes for its examples:

The five agricultural technologies behind the green revolution (2)

Machinery β€” tractors, combines, and other equipment let fewer workers farm far more land, and do it faster than hand or animal labor.

The five agricultural technologies behind the green revolution (3)

Irrigation β€” bringing water to land that wouldn't otherwise get enough rainfall, extending farming into drier regions and making yields more reliable.

The five agricultural technologies behind the green revolution (4)

Fertilizer β€” adds nutrients (especially nitrogen, phosphorus, potassium) back into soil faster than natural processes would, boosting how much a given plot of land can produce.

The five agricultural technologies behind the green revolution (5)

Terracing β€” cutting flat, step-like platforms into hillsides so crops can be planted on slopes that would otherwise erode or be too steep to farm.

The five agricultural technologies behind the green revolution (6)

Crop rotation β€” alternating which crop is planted in a field season to season, which helps keep soil nutrients from being used up by the same plant over and over.

The five agricultural technologies behind the green revolution (7)

Monoculture β€” growing one highly efficient variety across a huge area β€” boosted output too, but it's the green revolution's own named tradeoff: less genetic diversity, more vulnerability to a disease that targets that one variety.

Schematic course trends: coarse-grain production and yield rise strongly, harvested area changes much less, and seed declines late. No human-population series is shown.
Qualitative schematic based on the course’s grain figure, not an annual data plot. Human population is a separate part of the Malthus argument.
Likely on the quiz If your actual study-sheet answer key defines these differently or in more detail, trust your own course materials over this general summary β€” this card exists because the course's interactive wasn't capturable as text, not because it's a verbatim quote.
Not sure about this bit?

Subsistence vs. commercial agriculture

The green revolution shifted farming from subsistence agriculture (growing only for your own family or community) toward commercial agriculture (growing to sell), aided by better transportation and refrigeration β€” commercial agriculture is now possible almost anywhere, even in indoor facilities using artificial light.

Schematic course trends: coarse-grain production and yield rise strongly, harvested area changes much less, and seed declines late. No human-population series is shown.
Qualitative schematic based on the course’s grain figure, not an annual data plot. Human population is a separate part of the Malthus argument.
Likely on the quiz Subsistence = eat it yourself. Commercial = grow it to sell. New technology mainly expanded how much commercial agriculture is possible.

New problems from the green revolution

Heavy reliance on monoculture (growing one efficient crop variety at huge scale) has reduced biodiversity, leaving crops more vulnerable to a disease that targets that one variety. Pesticide and growth-hormone toxins can also work their way into food, soil, and water.

Schematic course trends: coarse-grain production and yield rise strongly, harvested area changes much less, and seed declines late. No human-population series is shown.
Qualitative schematic based on the course’s grain figure, not an annual data plot. Human population is a separate part of the Malthus argument.
Likely on the quiz If a question asks for a downside of the green revolution, "reduced biodiversity from monoculture" and "pesticide/hormone contamination" are the course's own two named risks.

Final checklist

Tick these off as you go. Saved in this browser.