3.3.5 Comparing Economic Systems β research prep
Unit 3 Β· Culture Β· Lesson 3.3 Economics
The big ideaThis activity is a real research task β you look up data for one developed country (Singapore), one developing country (Peru), and one least-developed country (Uganda), then reason about what the numbers show. The table asks specifically for HDI ranking 2024, sourced from the UN's Human Development Report 2023β24 snapshot. This page cannot do that lookup for you and won't guess at the numbers. It reviews exactly what each measurement means and exactly where the activity points you to find them, so the research itself goes fast.
By the end you can
Know what each requested measurement actually represents, before looking it up.
Use the UN Human Development Report and CIA World Factbook correctly, including the PPP warning.
Reason about whether HDI alone tells the whole story of quality of life.
Before you start: what PPP is actually adjusting for
The whole activity hinges on this one idea. Get it clear first and the research goes much faster.
Not sure about the basics underneath this lesson?
A dollar doesn't buy the same amount everywhere. A haircut that costs $30 in the U.S. might cost the local equivalent of $3 in another country. PPP (purchasing power parity) adjusts GDP so you're comparing "how much stuff this money can actually buy," not just a raw currency conversion.
1
Plain GDP just converts currency
It takes a country's economic output and converts it to dollars at the exchange rate β it says nothing about how far that money actually goes inside the country.
2
GDP (PPP) adjusts for local prices
It asks "what would this country's output be worth if prices there matched international averages?" That makes comparisons between rich and poor countries much fairer.
3
Mixing the two breaks the comparison
If you compare Singapore's plain GDP to Uganda's PPP-adjusted GDP, you're not comparing the same kind of number β like comparing a temperature in Celsius to one in Fahrenheit without converting.
Quick check β answer out loud before you peek
Why might a developing country's GDP (PPP) figure be noticeably higher than its plain GDP figure?
Because prices for goods and services tend to be lower in developing countries, so the same income buys more there β PPP adjustment reflects that extra purchasing power, which a plain currency conversion misses.
Got it now? Scroll back up and re-read the section β it should land differently.
Before filling those columns, confirm which archived edition or replacement source your teacher accepts. Record the year and basis of every figure. Keep the HDI ranking column tied to the activityβs 2023β24 report snapshot.
Keep the assigned HDI source separate from the other indicators.
What you're filling in, and why each column matters
The table asks for six measurements on Singapore, Peru, and Uganda β one from each development tier (developed, developing, least developed):
What you're filling in, and why each column matters (2)
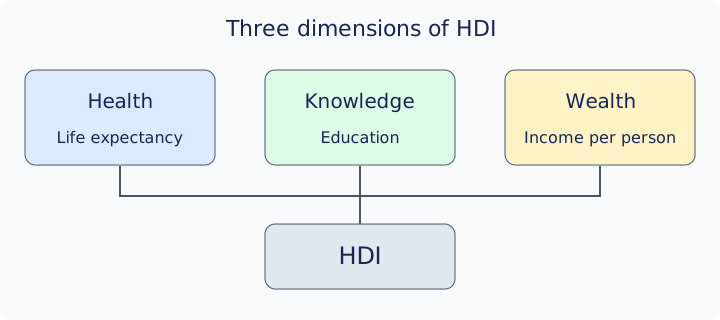
HDI ranking 2024 β the table's own label. This is the country's overall rank on the Human Development Index, combining health, knowledge, and wealth into one number, sourced from the UN's Human Development Report 2023β24 snapshot (the report that publishes the "2024" ranking the table wants).
What you're filling in, and why each column matters (3)
Life expectancy and world ranking β the average age someone in that country can expect to live to, and how that ranks worldwide.
What you're filling in, and why each column matters (4)
Infant mortality rate and world ranking β how many infants per 1,000 live births die before age one; a core health-care-quality signal.
What you're filling in, and why each column matters (5)
Adult literacy rate β the percentage of the adult population that can read and write.
What you're filling in, and why each column matters (6)
Real GDP and world ranking β the country's total economic output, and how that ranks worldwide.
What you're filling in, and why each column matters (7)
Per capita GDP and world ranking β total GDP divided by population, showing the average person's slice of that wealth.
What you're filling in, and why each column matters (8)
Real GDP and per capita GDP can rank very differently for the same country β a big population can produce a large total GDP while each person's share stays small. The other five measurements don't have a stated year the way HDI ranking does β different parts of the CIA World Factbook and the UN report get updated on their own schedules, so write down the year or edition each figure comes from as you fill in the table, rather than assuming everything is from the same "2024" snapshot.
A reference for separating development outcomes from total economic output.
Likely on the quizNotice the table deliberately separates total GDP from per-person GDP, and raw rate from world ranking. Each pair tells a different part of the story β don't collapse them into one number. And don't assume every number in your table shares one vintage; record the year for each one.
The PPP warning β don't mix your sources
The activity gives one very specific warning: all GDP figures must be compared on a purchasing parity basis (PPP) β adjusted so prices for the same goods and services are comparable across countries, since a dollar buys more in some countries than others. Your sources may label this "GDP (PPP)." The activity's own caution: don't use the plain GDP figure from one country and the GDP (PPP) figure for another in the same comparison β that mixes two different kinds of measurement and makes the comparison meaningless.
The activity names the World Factbook for the other measurements. Its old site now redirects to the CIAβs retirement announcement. Use an archived edition or replacement only after confirming that source for this assignment.
The PPP warning β don't mix your sources (4)
Both report PPP-adjusted figures; check which one each site is showing you before you copy a number into your table.
A reference for separating development outcomes from total economic output.
Likely on the quizBefore you write any GDP number into the table, check it says "PPP" (or an equivalent purchasing-power note) next to it β and make sure every GDP figure in your table uses the same basis.
Not sure about this bit?
This is a bookkeeping habit more than a hard concept β the trick is just staying consistent as you fill in the table.
1
Pick your source and stick with it per country
Use either the UN report or the CIA Factbook for a given country's GDP figures, and note which one you used.
2
Look for the label
Both real sources will tell you whether a number is PPP-adjusted β usually written right next to the figure or in the table header.
3
When in doubt, write it down
If you're not sure whether a number is PPP-adjusted, note that uncertainty next to it rather than guessing β it's better evidence for your later reasoning questions than a number you're not sure about.
Got it now? Scroll back up and re-read the section β it should land differently.
The three questions that come after the table
Once your table is filled in with real current numbers, the activity asks you to reason from it, not just report it:
The three questions that come after the table (2)
1. What does the life expectancy and infant mortality data say about the general quality of health care in these three countries? 2. What does comparing the adult literacy rates show you? 3. What does the gap between a country's overall GDP ranking and its per-capita GDP ranking tell you?
The three questions that come after the table (3)
Then a formal paragraph: does the HDI ranking of a country, by itself, actually tell you the full story of quality of life there? This is the same question 3.3.4 raised when it pointed out that HDI leaves out sanitation, water availability, political freedom, and social stability.
The three dimensions of HDI. HPI and GEM are separate measures.
Likely on the quizQuestion 5 wants a real position with evidence, not just "yes" or "no." Your own table β especially anything HDI doesn't capture, like a gap between real and per-capita GDP β is your evidence.