3.1.7 Demographics β€” section quiz

Unit 3 Β· Culture Β· Lesson 3.1 Demographics

The big idea Demography is counting people and describing how the count changes. Birthrate, death rate, and migration rate do almost all the work. Once you can read those rates, you can read the shape of a population pyramid, explain why a country is urbanizing, and say whether people are moving in or out.

By the end you can

  • Study the distribution of human population on Earth.
  • Use demographic information to compare two societies.
  • Describe the growth of the world's population.
  • Explain why and how populations move.

Before you start: rates are just ratios

This whole quiz leans on one math skill β€” reading a rate like "12.5 per 1,000" and knowing what to do with it. If rates feel slippery, this clears that up before the vocabulary piles on.

Not sure about the basics underneath this lesson?

Rabbit Nation: what the story's numbers really mean

The lesson opens with a story: Rabbit Nation starts with 1,000 rabbits. During the year, 1,000 more are born and 100 die. Do the arithmetic straight: 1,000 + 1,000 βˆ’ 100 = 1,900 rabbits by year's end.

Rabbit Nation: what the story's numbers really mean (2)

That's a net gain of 900 rabbits over a starting population of 1,000 β€” a 90% natural increase for the year (900 Γ· 1,000).

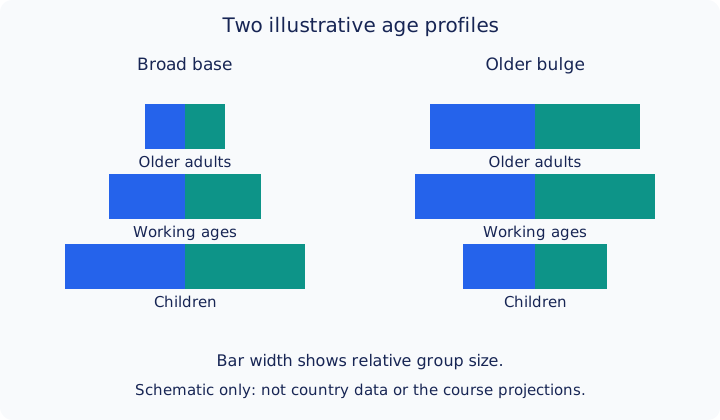
Illustrative age profiles: a broad child-age base compared with an older bulge. These are not country statistics.
Use the shape to practice age-structure reasoning. The schematic is not the numerical Germany/Indonesia projections.
Likely on the quiz Verify it yourself: 1,000 start + 1,000 born βˆ’ 100 died = 1,900 end. Net gain 900. 900 Γ· 1,000 = 90%. That 90% is the real natural-increase rate for the year.
Not sure about this bit?

The story's own labels β€” and why they're confusing

The lesson's own narration calls the birth count a "birthrate of 2.0," the death count a "death rate of 0.1," and 2.0 βˆ’ 0.1 a "growth rate of 1.9." Those labels don't match the standard births per 1,000 population statistic the lesson uses correctly later (see the next card) β€” applied that way, this same story would be a birthrate of 1,000 per 1,000 and a death rate of 100 per 1,000.

The story's own labels β€” and why they're confusing (2)

What 1.9 actually is: the ending population as a multiple of the starting population β€” 1,900 Γ· 1,000 = 1.9Γ—. That's an ending multiplier, not a rate. If a quiz question uses the story's own wording and asks for "the growth rate" of Rabbit Nation, the course's expected answer is 1.9 β€” just know that what you're really reporting is how many times bigger the population got, not a standard demographic rate.

Two illustrative population age profiles, one with a broad child-age base and one with an older bulge.
A schematic reference for age-structure reasoning; not country data.
Likely on the quiz Two different, both-correct answers live in this one story: the real natural-increase rate is 90%. The course's own in-story number is 1.9 (the ending multiplier). Know which one a question is actually asking for.
Not sure about this bit?

Turning a rate into a real number

Here's the standard version, used correctly later in the same lesson: birthrate is genuinely stated per 1,000 people, and it's a ratio you can work forward or backward from a real headcount. The course's own worked example: a country with a birthrate of 12.5 and a population of 22 million had 275,000 births that year.

Turning a rate into a real number (2)

The math: 12.5 Γ· 1,000 = 0.0125. Multiply by the population: 22,000,000 Γ— 0.0125 = 275,000.

Turning a rate into a real number (3)

Growth rate from births and deaths alone (birthrate minus death rate) is sometimes called the natural increase rate β€” it leaves out migration. A country's total population growth also depends on its migration rate, so "subtract death rate from birthrate" only tells you the natural piece, not the whole picture.

Two illustrative population age profiles, one with a broad child-age base and one with an older bulge.
A schematic reference for age-structure reasoning; not country data.
Likely on the quiz Fertility rate answers "how many kids per woman, over a lifetime." Birthrate answers "how many births this year, per 1,000 people." Birthrate minus death rate gives natural increase only β€” add migration rate to get total growth.

Population vs. population density

The lesson's own three-choice question asks which statement is true: (A) Utah has a larger population than Bangladesh, (B) Bangladesh is geographically larger than Utah, or (C) Bangladesh has more people in less space than Utah. The correct answer is C β€” Bangladesh's population (in the hundreds of millions) is vastly larger than Utah's (a few million), and Bangladesh packs that population into a much smaller area, making it one of the most densely populated countries on Earth. Utah, by contrast, is one of the more sparsely populated U.S. states.

Population vs. population density (2)

The lesson does make one genuine comparison point: Utah has the highest birthrate and fertility rate of any U.S. state, which the lesson calls "relatively close" to Bangladesh's. That comparison is about rates, not population size or density β€” a reminder that population density (people per unit of area) is a separate measurement from birthrate, fertility rate, or total population, and they don't automatically move together.

Side-by-side photos: a crowded river market scene in Bangladesh next to a wide, empty desert landscape in Utah
Bangladesh (left) and Utah (right) β€” the course's own density contrast. Bangladesh has far more people in far less space.
Likely on the quiz If a question mentions square miles, crowding, or "people per area," it wants density. Don't confuse that with total population β€” Bangladesh wins on both population size and density here, not just density.

Comparing two real countries: Germany and Indonesia

This is the course's full worked comparison, and it's exactly the shape a quiz question is likely to copy. The numbers:

Comparing two real countries: Germany and Indonesia (2)

β€’ Population density: Germany 230 people/kmΒ², Indonesia 122 people/kmΒ² β€” Germany is more crowded by this measure, even with far fewer total people.
β€’ Birthrate: Germany 8.2 per 1,000, Indonesia 19.65 per 1,000 β€” Indonesia's is more than double.
β€’ Death rate: Germany 10.71, Indonesia 6.25 (both per 1,000).
β€’ Migration rate: Germany +2.18 (positive β€” more people arriving), Indonesia βˆ’1.27 (negative β€” more people leaving).
β€’ Growth rate: Germany βˆ’0.033% (shrinking), Indonesia +1.213% (growing).

Comparing two real countries: Germany and Indonesia (3)

Put together: Germany's population is aging and shrinking, held roughly level only by people moving in. Indonesia's population is young and growing from births, even though more people are leaving than arriving.

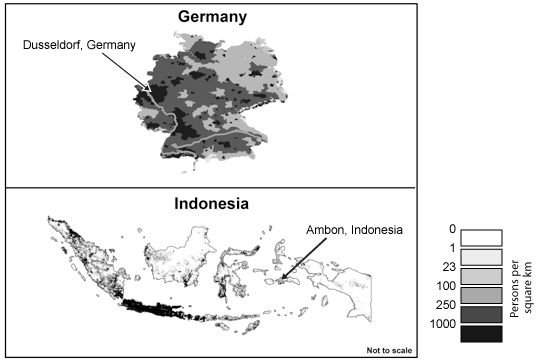
Shaded population-density maps of Germany and Indonesia, each marked with a labeled city and a persons-per-square-kilometer legend
The course's own distribution maps: DΓΌsseldorf, Germany vs. Ambon, Indonesia, each showing people per square kilometer.
Likely on the quiz Germany's story is low birthrate + higher death rate + positive migration = shrinking population propped up by immigration. Indonesia's is high birthrate + lower death rate + negative migration = growing population despite emigration. Know which direction each rate points for each country.

Migration rate, and who counts as what

A migration rate is immigrants minus emigrants per 1,000 people. Every person who moves is simultaneously an emigrant (leaving one place) and an immigrant (arriving in another) β€” the same move, counted from two sides.

Two illustrative population age profiles, one with a broad child-age base and one with an older bulge.
A schematic reference for age-structure reasoning; not country data.
Likely on the quiz Migration rate is part of total population growth, alongside the natural increase rate (birthrate minus death rate) from earlier in this quiz.

Push factors, pull factors, and the New York/Atlanta example

Push factors are reasons to leave a place β€” war, persecution, overcrowding, high unemployment. Pull factors are reasons to go toward a place β€” jobs, favorable climate, political stability.

Push factors, pull factors, and the New York/Atlanta example (2)

When push factors are extreme β€” war, persecution, government relocation β€” people are coerced into leaving. That's forced migration, also called displacement. Most migration, though, is voluntary migration: people choosing to leave because the push and pull are strong enough.

Push factors, pull factors, and the New York/Atlanta example (3)

The course's own numbers: New York City loses about 211,000 people a year to domestic migration (strong push: crowding, high cost of living, long commutes), while Atlanta gains roughly 31,000 a year (pull: more space, lower living costs, even though average wages are lower there).

Split photo: a dense daytime New York City skyline on the left, a sunnier Atlanta skyline with fewer, shorter towers on the right
New York City (left) vs. Atlanta (right) β€” the course's own contrast in domestic migration.
Likely on the quiz War, persecution, or a government forcing people out β†’ forced migration. A better job or climate pulling someone β†’ voluntary migration, driven by push and pull factors.

Why cities keep growing

In 1950, about 70% of the world's population was rural and less than 30% was urban. The course describes the share of the world living in urban areas as having climbed since then, and expects it to keep climbing. The process of a society becoming more city-oriented is urbanization.

Why cities keep growing (2)

Two engines drive it, per the course: industrialization moves jobs into cities (factories need workers, workers need factories β€” a self-reinforcing cycle), and culture pulls people too (more to do, more people to meet).

Two illustrative population age profiles, one with a broad child-age base and one with an older bulge.
A schematic reference for age-structure reasoning; not country data.
Likely on the quiz If a question asks why cities grow, the course's own two reasons are industrialization (jobs) and culture (more to do) β€” not just "more babies are born in cities," even though that's a smaller contributing factor too.

Urbanism, metropolitan areas, and the tradeoffs of city life

The United States is the course's own example of strong urbanism β€” a culture centered on dense living, working, and recreation β€” even though the country still has wide-open rural land. Most Americans, per the course, now live inside one metropolitan area or another, where a city center spreads out through suburbs and satellite towns.

Urbanism, metropolitan areas, and the tradeoffs of city life (2)

City life has upsides the course names β€” cultural mixing, tolerance, opportunity β€” and downsides: crowding, cost pressure, and more friction between different groups of people living close together.

Two illustrative population age profiles, one with a broad child-age base and one with an older bulge.
A schematic reference for age-structure reasoning; not country data.
Likely on the quiz Urbanization is the process (a society becoming more city-oriented). Urbanism is the resulting culture (an emphasis on dense city living). The U.S. is the course's named example of the second one.

The world's population explosion

The last time world population actually decreased, per the course, was the 1300s, during the Black Death β€” a pandemic that killed an estimated 75 million people, including about a third of Europe. Growth sped up dramatically after the Industrial Revolution: it had taken centuries to double the population before then, but the 18th century managed it in about 100 years. In the 20th century, the course states, population doubled twice: from 1.5 billion (1900) to 3 billion (1960), then to 6 billion (2000). The course states world population passed 7 billion in 2011.

The world's population explosion (2)

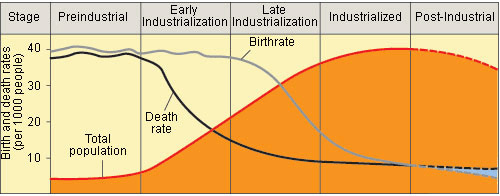
This pattern β€” death rate falling first as a society industrializes, with birthrate staying high a while longer, producing a population boom in between β€” is demographic transition. Eventually birthrate falls too, usually because raising children gets more expensive, and the population levels off again at a much larger size.

Line graph of birth and death rates across five labeled stages β€” preindustrial, early industrialization, late industrialization, industrialized, post-industrial β€” with total population shaded underneath
The course's demographic transition graph: preindustrial β†’ early/late industrialization β†’ industrialized β†’ post-industrial, tracking birthrate, death rate, and total population.
Likely on the quiz Demographic transition has an order: death rate drops first (industrialization makes survival easier), birthrate stays high a while longer (population booms), then birthrate drops too (population levels off). Get the order of the two drops right.

Cartograms: resizing the world by a number, not land

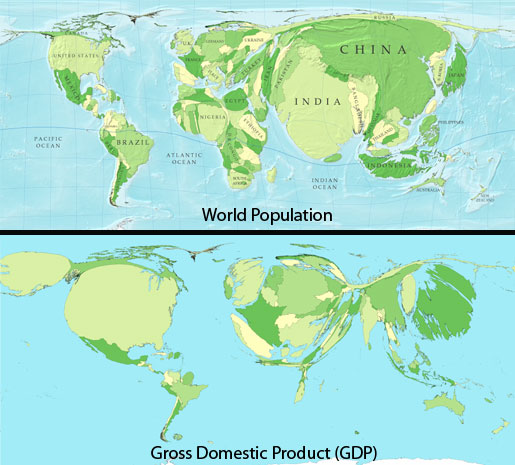
A cartogram distorts the area of countries to represent something other than land size β€” population, GDP, energy use. Look at the world population and GDP cartogram below: countries don't just change color, their actual shapes balloon or shrink. China and India swell hugely on the population map because of their populations, not their land area.

Cartograms: resizing the world by a number, not land (2)

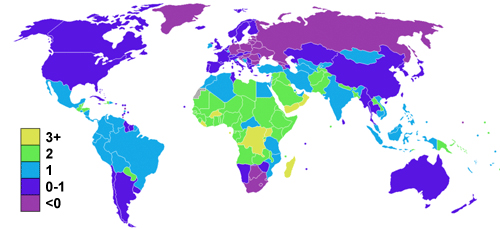
Compare that with an ordinary thematic map, like the population-growth-rate map further down this card: every country keeps its real size and shape, and only the color changes to show the data. That's the test β€” a cartogram resizes shapes; a thematic map just recolors them.

Two world cartograms with country shapes resized by population (top) and by gross domestic product (bottom), both very different from a normal map
A real cartogram: world population (top) and gross domestic product (bottom), with every country's shape resized by that value. Compare the swollen shapes of China, India, and the U.S. in each map.
World map with countries in their true shape and size, color-coded from dark purple (negative growth) to bright green (3%+ growth)
Contrast: this is a thematic map, not a cartogram β€” population growth rate by country, with every country's real shape and size kept intact and only the color changing.
Likely on the quiz Look at the two maps above side by side: in the cartogram, country shapes change size. In the thematic map, shapes stay normal and only color changes. If a question shows you a map and asks "cartogram or thematic?", that's the one thing to check.
Not sure about this bit?

Final checklist

Tick these off as you go. Saved in this browser.