Unit 1 Β· Introduction to Geography Β· Lesson 1.3 The Map Case
The big ideaSatellites take pictures. A person still decides what the map will show. Cartography did not improve in a slow drip. It jumped, especially in the 1400sβ1500s and again in the 1900s. This walkthrough follows the Apex pages, including the nine mapmakers. For each one you get the date, what they contributed, and what to sketch.
By the end you can
Explain that humans still make maps, even with satellites and computers.
Name the two periods the lesson flags as big leaps: the 15thβ16th century age of exploration, and the 20th-century technology boom.
For each of the nine cartographers, match the date and say what they contributed.
Before you start: this is a people lesson
The last studies were about flattening globes. This one is history plus a modern studio. Open this if that shift feels like a new course.
Not sure about the basics underneath this lesson?
A satellite can take a picture. A person still decides what the map will show. Nine mapmakers sit on a timeline. For each one, learn the date and what they contributed. Then look at a studio now.
1
Two jump periods
15thβ16th century age of exploration, and 20th-century technology. Not a tiny drip every year.
2
Notes means the contribution
What they did for maps, in a sentence. Not a full life story.
3
Two names you already met as map styles
Mercator (poles stretch). Robinson (oval compromise). That is 1.3.1. Here they also get dates: 1569 and 1963.
Quick check β answer out loud before you peek
Does a satellite 'make' a map in this lesson's sense?
No. Satellites help. A human being still makes every map.
Got it now? Scroll back up and re-read the section β it should land differently.
Satellites help. People still make the map.
You have already seen aerial photographs and orbiting satellites in this unit. They matter a lot for cartography today. They do not press a button and spit out a finished map.
Satellites help. People still make the map. (2)
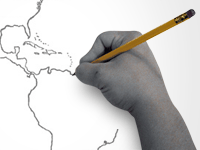
The lesson's line is blunt: every map that has ever existed was made by a human being. Someone chose the edges, the labels, the colors, what to leave off.
Satellites help. People still make the map. (3)
This activity has two halves. First you step back into history and meet people who pushed mapmaking forward. Then you look at a studio now, including people who still spend their days with maps.
Apex's page-1 picture. Caption in the course: all maps are the product of human hands.
Likely on the quizIf a later question says satellites now create maps with no person involved, the lesson says that is wrong.
It jumped. It did not drip.
Cartography is the art and science of making maps. It did not get a little better every year like a plant growing. The lesson says it was usually pushed forward in sudden leaps.
It jumped. It did not drip. (2)
Two leaps it names: β’ The age of exploration in the 15th and 16th centuries (the 1400s and 1500s), when ships were going to places that were new to the mapmakers β’ The technological boom of the 20th century (the 1900s), when cameras, planes, computers, and satellites showed up
It jumped. It did not drip. (3)
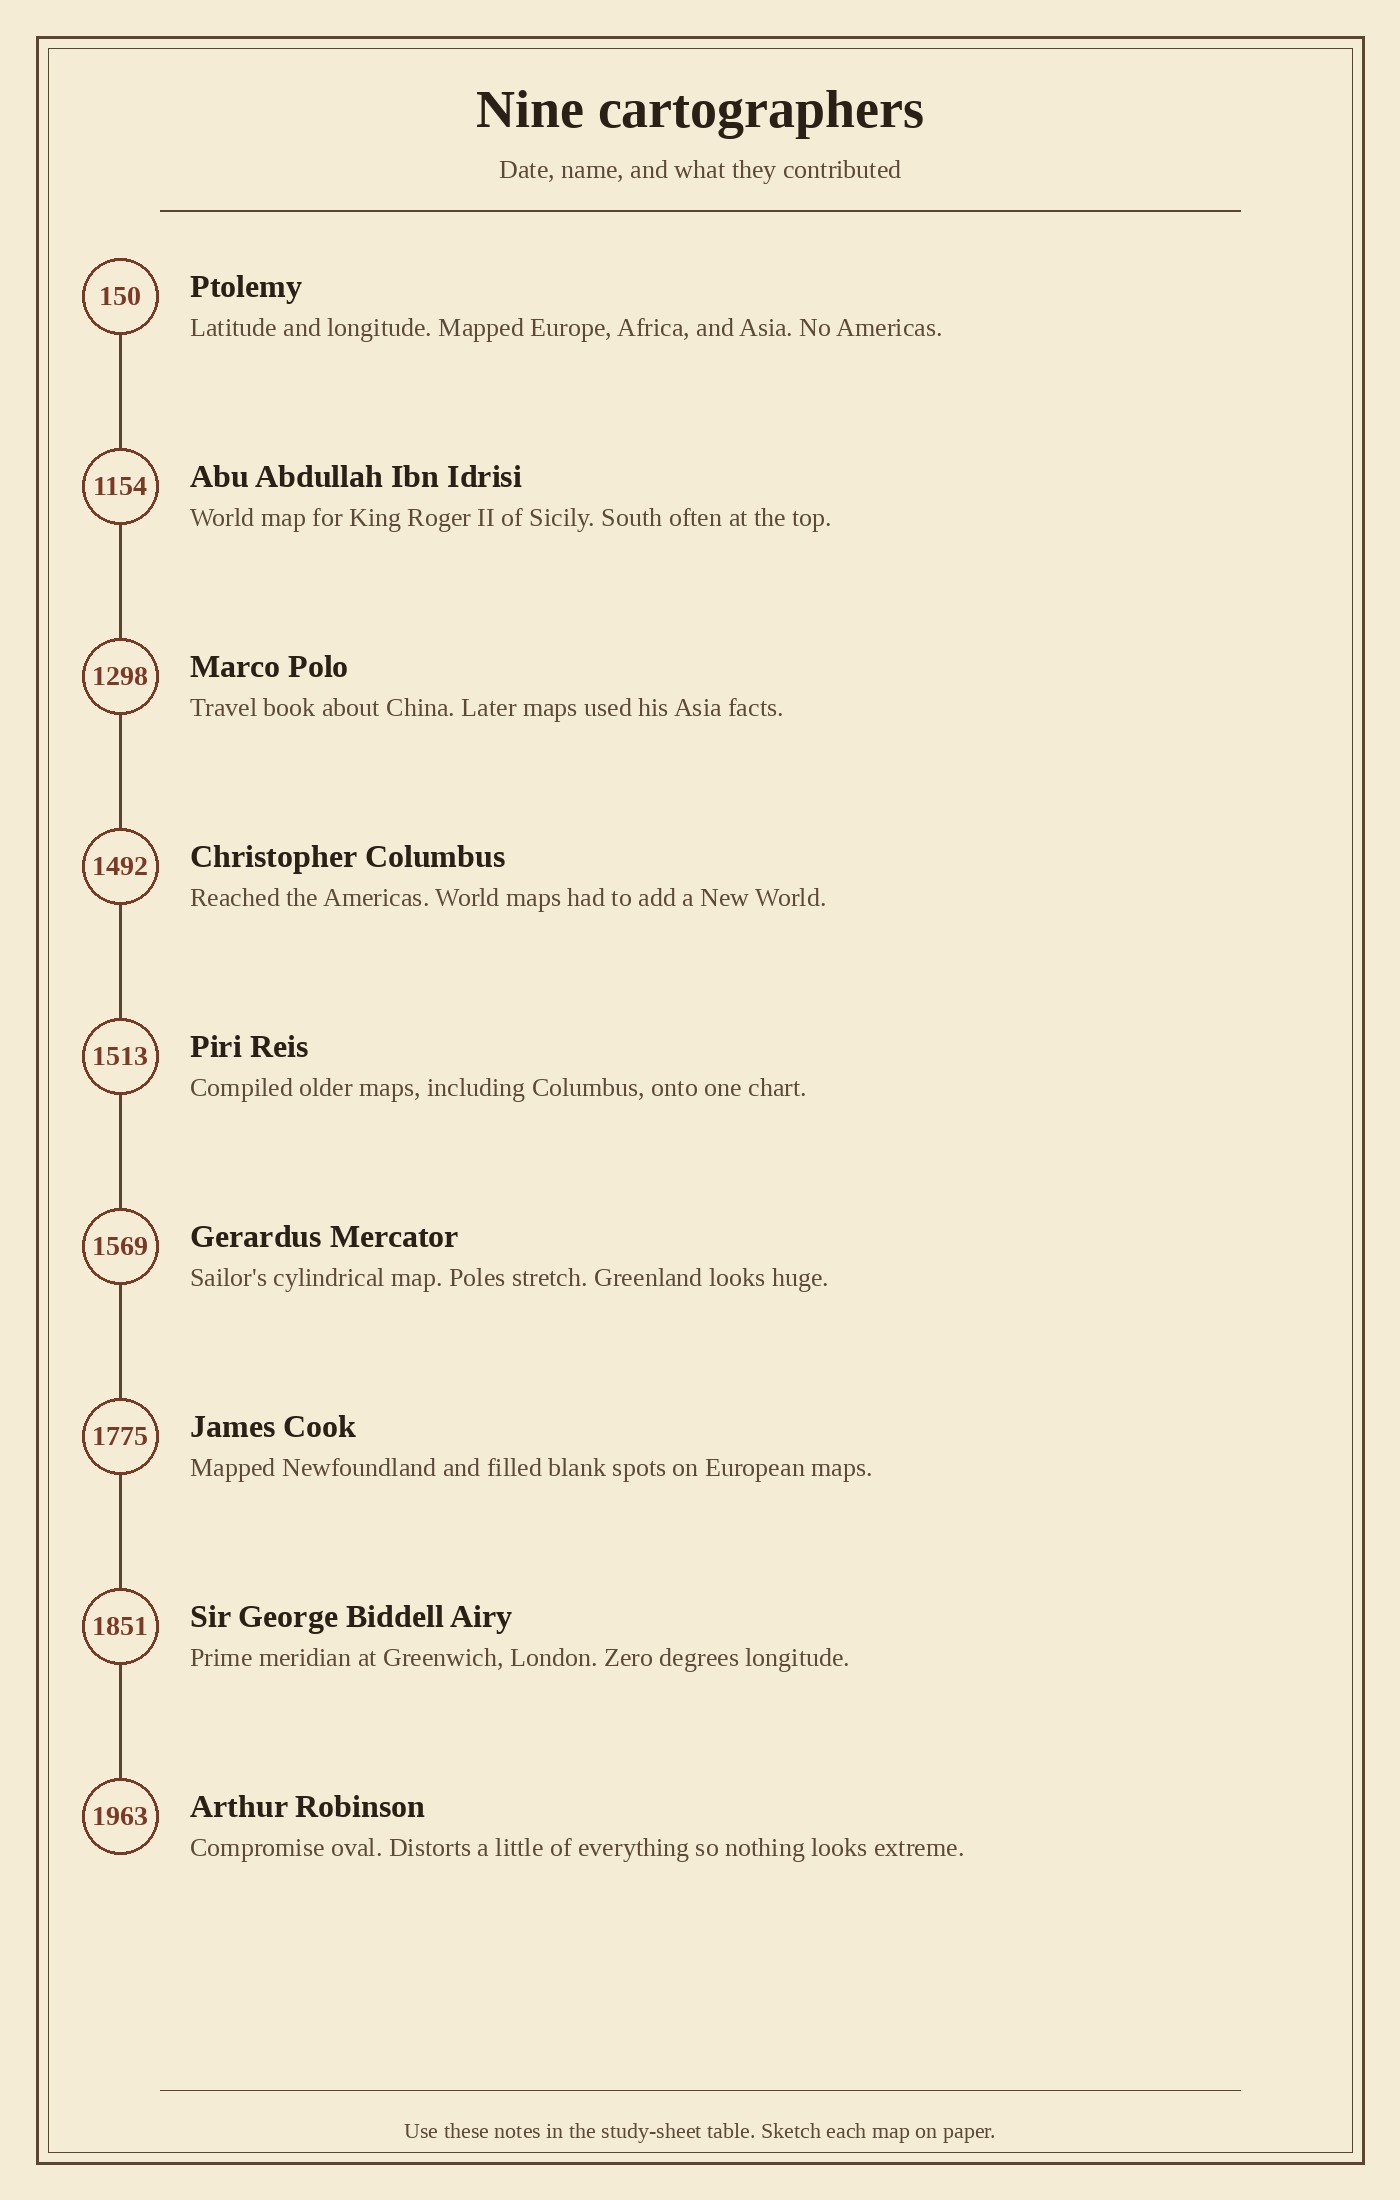
On the Apex page you click a timeline. Each date opens a person and what they contributed. The nine beats below are that same timeline, in order, with the notes and what to sketch.
Likely on the quizRemember the shape: leaps, not a smooth slope. 1400sβ1500s, and the 1900s.
The cartography timeline
Ptolemy (150). He wrote Geography. He used latitude and longitude to locate places, and he mapped the world as he knew it: Europe, Africa, and Asia. No Americas, because that was still unknown to him. Mapmakers used his work for centuries. Sketch: a world of three continents, no North or South America.
The cartography timeline (2)
Abu Abdullah Ibn Idrisi (1154). He made a detailed world map for King Roger II of Sicily, putting traveler reports together with older Greek and Arabic geography. Many copies put south at the top, so the map can look upside down next to ours. Sketch: a packed medieval world map, south-up if you want the period look.
The cartography timeline (3)
Marco Polo (1298). He traveled from Europe to China and wrote the book of what he saw. He was not mainly a map drawer. Later cartographers used his descriptions to add facts about Asia they had not had before. Sketch: a route from Europe across Asia, not a fancy finished world map.
The cartography timeline (4)
Christopher Columbus (1492). He sailed west and reached the Americas. After that, world maps had to add a New World that Ptolemy never knew. This course also uses 1492 as the New World date in 1.1.1. Sketch: the Atlantic with islands on the far side, or a world that has suddenly grown a fourth landmass.
The cartography timeline (5)
Piri Reis (1513). An Ottoman admiral. He compiled a world map from many older maps, including one from Columbus. Only part of it survives. That piece shows Atlantic coasts of the Americas and Africa. Apex gives him his own review screen next, because he is the "put a pile of observations on one sheet" person in the 1500s leap. Sketch: a torn Atlantic chart, South America and Africa facing each other.
The cartography timeline (6)
Gerardus Mercator (1569). He drew a world map for sailors. On his cylindrical projection, a compass course is a straight line. The cost: land near the poles stretches, so Greenland looks huge. You already met this family in 1.3.1. Sketch: a rectangle world with a giant Greenland.
The cartography timeline (7)
James Cook (1775). A British navigator. He mapped Newfoundland and filled in blank spots on European maps of the world. By 1775 that included large stretches of Pacific coast that had been empty on older European sheets. Sketch: a world with New Zealand and more Pacific coastline drawn in.
The cartography timeline (8)
Sir George Biddell Airy (1851). Astronomer Royal. In 1851 his instrument at Greenwich, London, set the meridian that became the world's prime meridian: 0Β° longitude. That is the zero line you already use in 1.3.2, and the one 1.3.4 names as Greenwich, England. Sketch: a globe with one north-south line through London labeled 0Β°.
The cartography timeline (9)
Arthur Robinson (1963). He designed a compromise world-map projection. It distorts a little of everything so nothing looks extreme. The usual picture is an oval world, with Greenland back down to size. You already met this family in 1.3.1. Sketch: an oval world map.
The same nine people as the Apex timeline. Date, name, and the contribution to put in Notes.
Likely on the quizYour notebook table wants name, date, notes, and a rough sketch. The notes are what they contributed, not a full biography.
Not sure about this bit?
Nine people. Same order as Apex. Date plus what they contributed.
1
150 Ptolemy
Latitude and longitude. Europe, Africa, Asia. No Americas.
2
1154 Ibn Idrisi
World map for the King of Sicily. South often at the top.
3
1298 Marco Polo
Travel book about China. Later maps used his Asia facts. He was not mainly a map drawer.
4
1492 Columbus
Reached the Americas. Maps had to add a New World.
5
1513 Piri Reis
Compiled older maps, including Columbus, onto one chart.
6
1569 Mercator
Sailor's cylindrical map. Poles stretch. Greenland looks huge.
7
1775 Cook
Mapped Newfoundland and filled blank spots on European maps.
8
1851 Airy
Prime meridian at Greenwich, London. Zero degrees longitude.
9
1963 Robinson
Compromise oval. Distorts a little of everything.
Quick check β answer out loud before you peek
Who set the 0Β° longitude line in London, and in what year?
Sir George Biddell Airy, 1851. That is the Greenwich line from 1.3.2.
Got it now? Scroll back up and re-read the section β it should land differently.
Pause on Piri Reis
After the timeline, Apex stops on one name: Piri Reis. You just saw part of the history of cartography. Now review his contribution on its own.
Pause on Piri Reis (2)
He is the 1513 row. Ottoman admiral and cartographer. He did not sail out and invent the Americas from scratch. He compiled. He took many older maps, including one connected to Columbus, and drew them onto one chart. The piece that survives is the western half: Europe and Africa on one side of the Atlantic, parts of the Americas on the other.
Pause on Piri Reis (3)
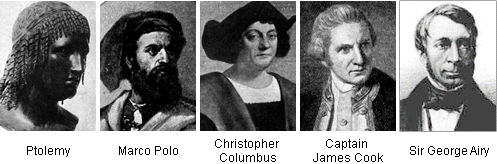
Apex's recap picture on this page shows five of the timeline faces: Ptolemy, Marco Polo, Columbus, Cook, and Airy. Piri Reis is the extra review in the middle of that history.
Pause on Piri Reis (4)
That is why he sits in the 15thβ16th century leap. Ships were bringing new observations home. Someone still had to sit down and make a picture out of them.
Apex's recap strip after the timeline: Ptolemy, Marco Polo, Columbus, Cook, Airy.
Likely on the quizIf a question asks who compiled a 1513 world map using older charts, including Columbus, the answer is Piri Reis.
Not sure about this bit?
Apex stops on him after the timeline on purpose.
1
Compiler, not the first sailor
He put many older maps, including one from Columbus, onto one sheet.
2
What survives
A piece of the western half: Atlantic coasts of the Americas and Africa.
Quick check β answer out loud before you peek
If a question says '1513 world map compiled from older charts,' who is that?
Piri Reis.
Got it now? Scroll back up and re-read the section β it should land differently.
From sketches to less distortion
Apex then reviews how cartography went from rough sketches to world maps with much less distortion. The first step it names is the collection of fact-based observations. That is the whole point of this history. Guess less. Go look. Write it down. Put it on the map.
From sketches to less distortion (2)
You can walk that journey on the nine names. Polo and Columbus bring new observations home. Piri Reis compiles them onto one sheet. Ptolemy already gave places numbers (latitude and longitude). Airy later gives everyone the same zero line for longitude. Mercator makes a projection sailors can actually steer with. Cook goes and fills coasts that were still blank. Robinson tries to draw the whole world without one region looking cartoon-huge.
From sketches to less distortion (3)
Better instruments and more observations, less guesswork. That is the same idea 1.3.4 will spend a whole reading on.
Likely on the quizThe modern-day map did not appear in one year. It is stacked observations, then a grid, then a projection that matches the job.
A studio now: computers, pencils, and people who love maps
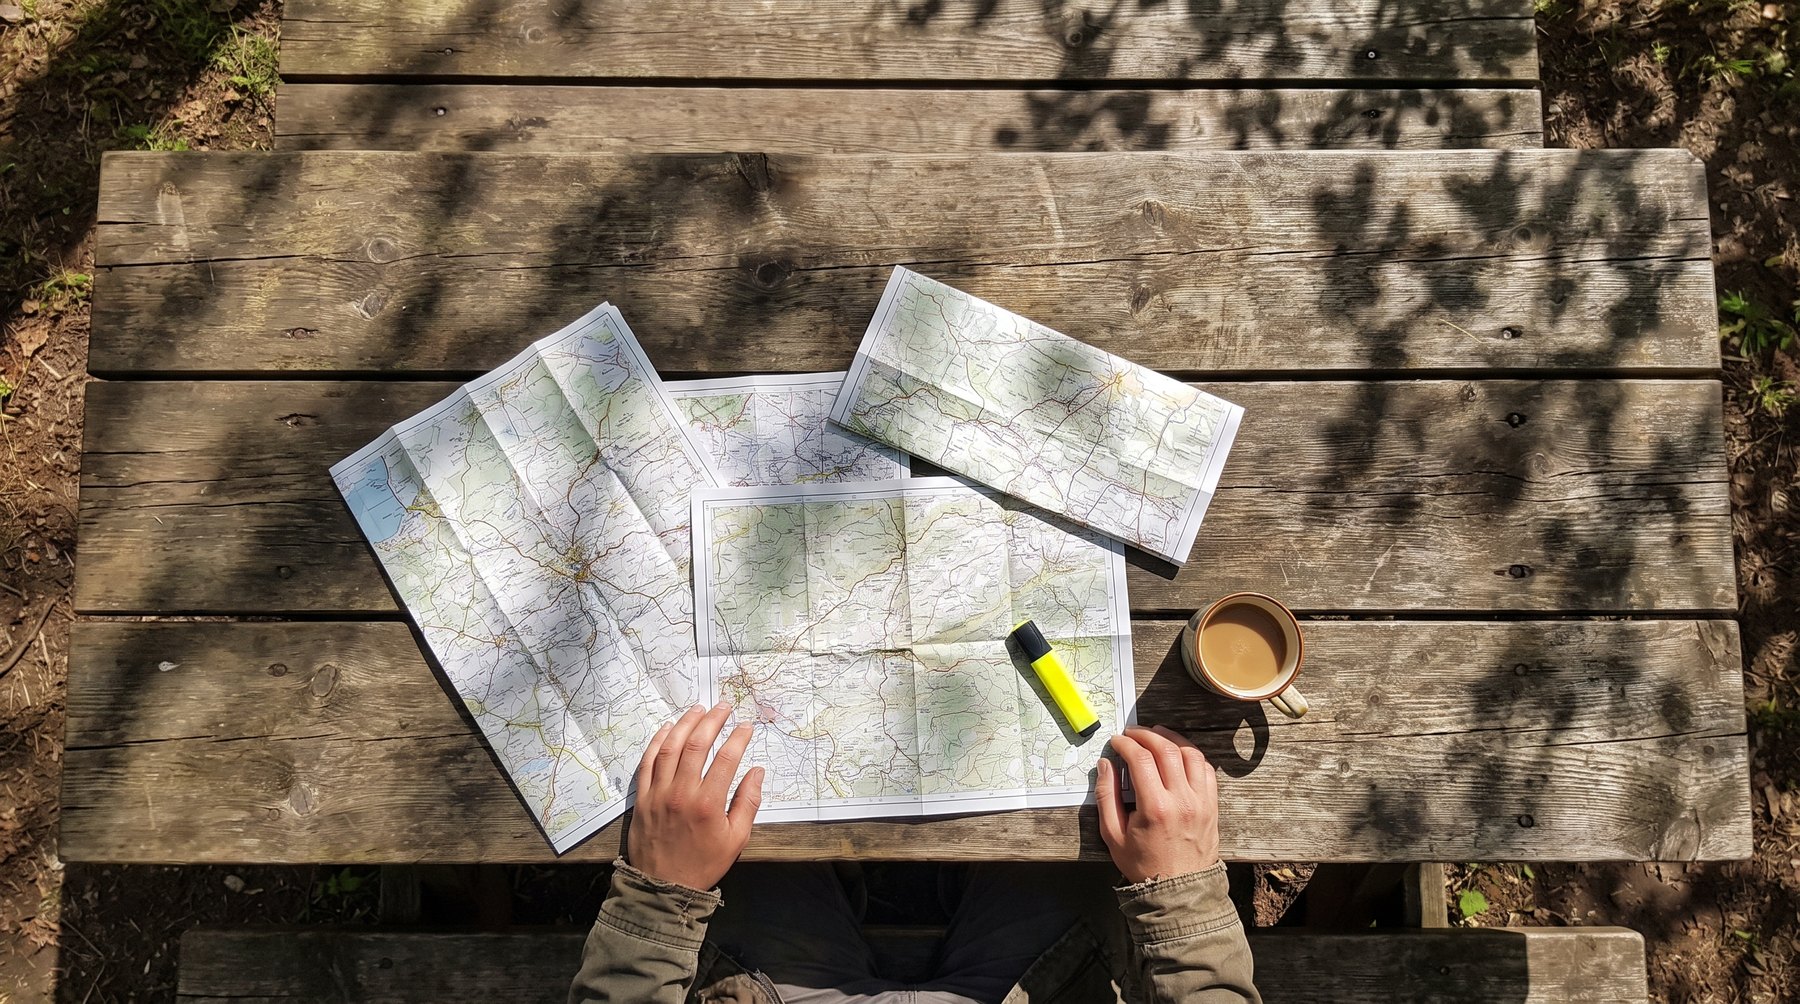
Mapmaking did not stop in 1963. People still make maps and still use them. The current trend is computers and databases to show spatial information. Hand-drawn maps are still being made and used too. Either way, making a picture of the world is a creative act. Some people even collect maps and hang them on walls.
A studio now: computers, pencils, and people who love maps (2)
Apex sends you to three interviews. They are part of the lesson, not extra credit.
A studio now: computers, pencils, and people who love maps (3)
β’ Brad Herried, cartographer and web developer at the Polar Geospatial Center (University of Minnesota). He maps Antarctica, Earth's most remote continent. Ice, almost no ordinary landmarks, and data that is hard to collect. That is a present-day studio problem.
A studio now: computers, pencils, and people who love maps (4)
β’ Richard Horwitz, a road-map collector (more than 12,000 maps). He started at nine, following Sinclair maps on a family drive to Florida. He collects oil-company maps by cover design. Old maps from the 1920s and 1930s are his favorites because of the cover art. Dating a map with no year: if a U.S. state map has no U.S. highway numbers, it is from before 1926. The lesson's point: some people use maps for pleasure, not only for work.
A studio now: computers, pencils, and people who love maps (5)
β’ Dr. David M. Theobald on GIS: how he got started, GIS in education, and GIS for conservation. That interview is the bridge into 1.3.6.
A studio now: computers, pencils, and people who love maps (6)
A cartographer's studio today can be a drafting pad or a computer. The person is still in the chair.
Likely on the quizPresent-day cartography uses computers and databases and still includes hand-drawn maps. GIS is next, not instead of people.
Your geographer's notebook
The study sheet is a table: Cartographer, Date, Notes, Sketch of Map. Apex already printed the names and dates. Your job is the Notes and a rough sketch of that person's map.
Your geographer's notebook (2)
Use the nine beats you just walked. Notes means what they contributed, in a sentence or two. Sketch means a quick picture that would let you tell those maps apart later: three continents for Ptolemy, south-up for Idrisi, a route for Polo, a New World for Columbus, a torn Atlantic for Piri Reis, a huge Greenland for Mercator, filled Pacific coasts for Cook, a 0Β° line through London for Airy, an oval for Robinson.
Likely on the quizIf two names blur, sort them by job: traveler (Polo), compiler (Piri Reis), sailor's projection (Mercator), zero line (Airy), oval compromise (Robinson).
Not sure about this bit?
Four columns: name, date, notes, sketch. Names and dates are already on the sheet.
1
Notes
The contribution in a sentence. Use the nine beats you just walked.
2
Sketch
Just enough to tell them apart: three continents, south-up, a route, a New World, a torn Atlantic, huge Greenland, filled Pacific, a 0Β° line, an oval.
Quick check β answer out loud before you peek
Polo and Piri Reis both belong on the table. What is the difference in the Notes column?
Polo brought Asia facts home by traveling. Piri Reis compiled older maps onto one chart.
Got it now? Scroll back up and re-read the section β it should land differently.