Unit 1 · Introduction to Geography · Lesson 1.3 The Map Case
The big ideaA map is a picture of the world. It leaves most of what you can see out of the picture, so you can focus on what you need. That picture is never perfect. The Earth is round and paper is flat, so every projection stretches something. If you can name the map type, the projection, and a latitude/longitude point, you can read almost any map in this course.
By the end you can
Explain what a map is for, and what mapmakers decide before they draw one.
Name the common map types and the four families of projection.
Use latitude and longitude, including the special lines, to find a place.
Before you start: words this lesson uses
This lesson uses words like projection, meridian, and hierarchy. You do not need to have made a map before. Open this if flattening a globe still feels confusing.
Not sure about the basics underneath this lesson?
You already use maps. This lesson names the choices inside them. A map is a picture. It leaves most of the real world out on purpose. The Earth is round and paper is flat, so every world map stretches something. Latitude is how far north or south. Longitude is how far east or west. The rest of the lesson is vocabulary for those facts.
1
A map is not the place. It is a picture of the place.
Look out a window. Then look at a map of the same street. The window has weather, people, and the color of a car. The map dropped those things so you could see the street. That choosing is cartography.
2
The Earth is a ball. Paper is flat. Something has to stretch.
Peel an orange and press the peel onto a table. It rips or it bunches up. Every world map is that peel. The different ways of flattening it are called projections.
3
Latitude first, then longitude
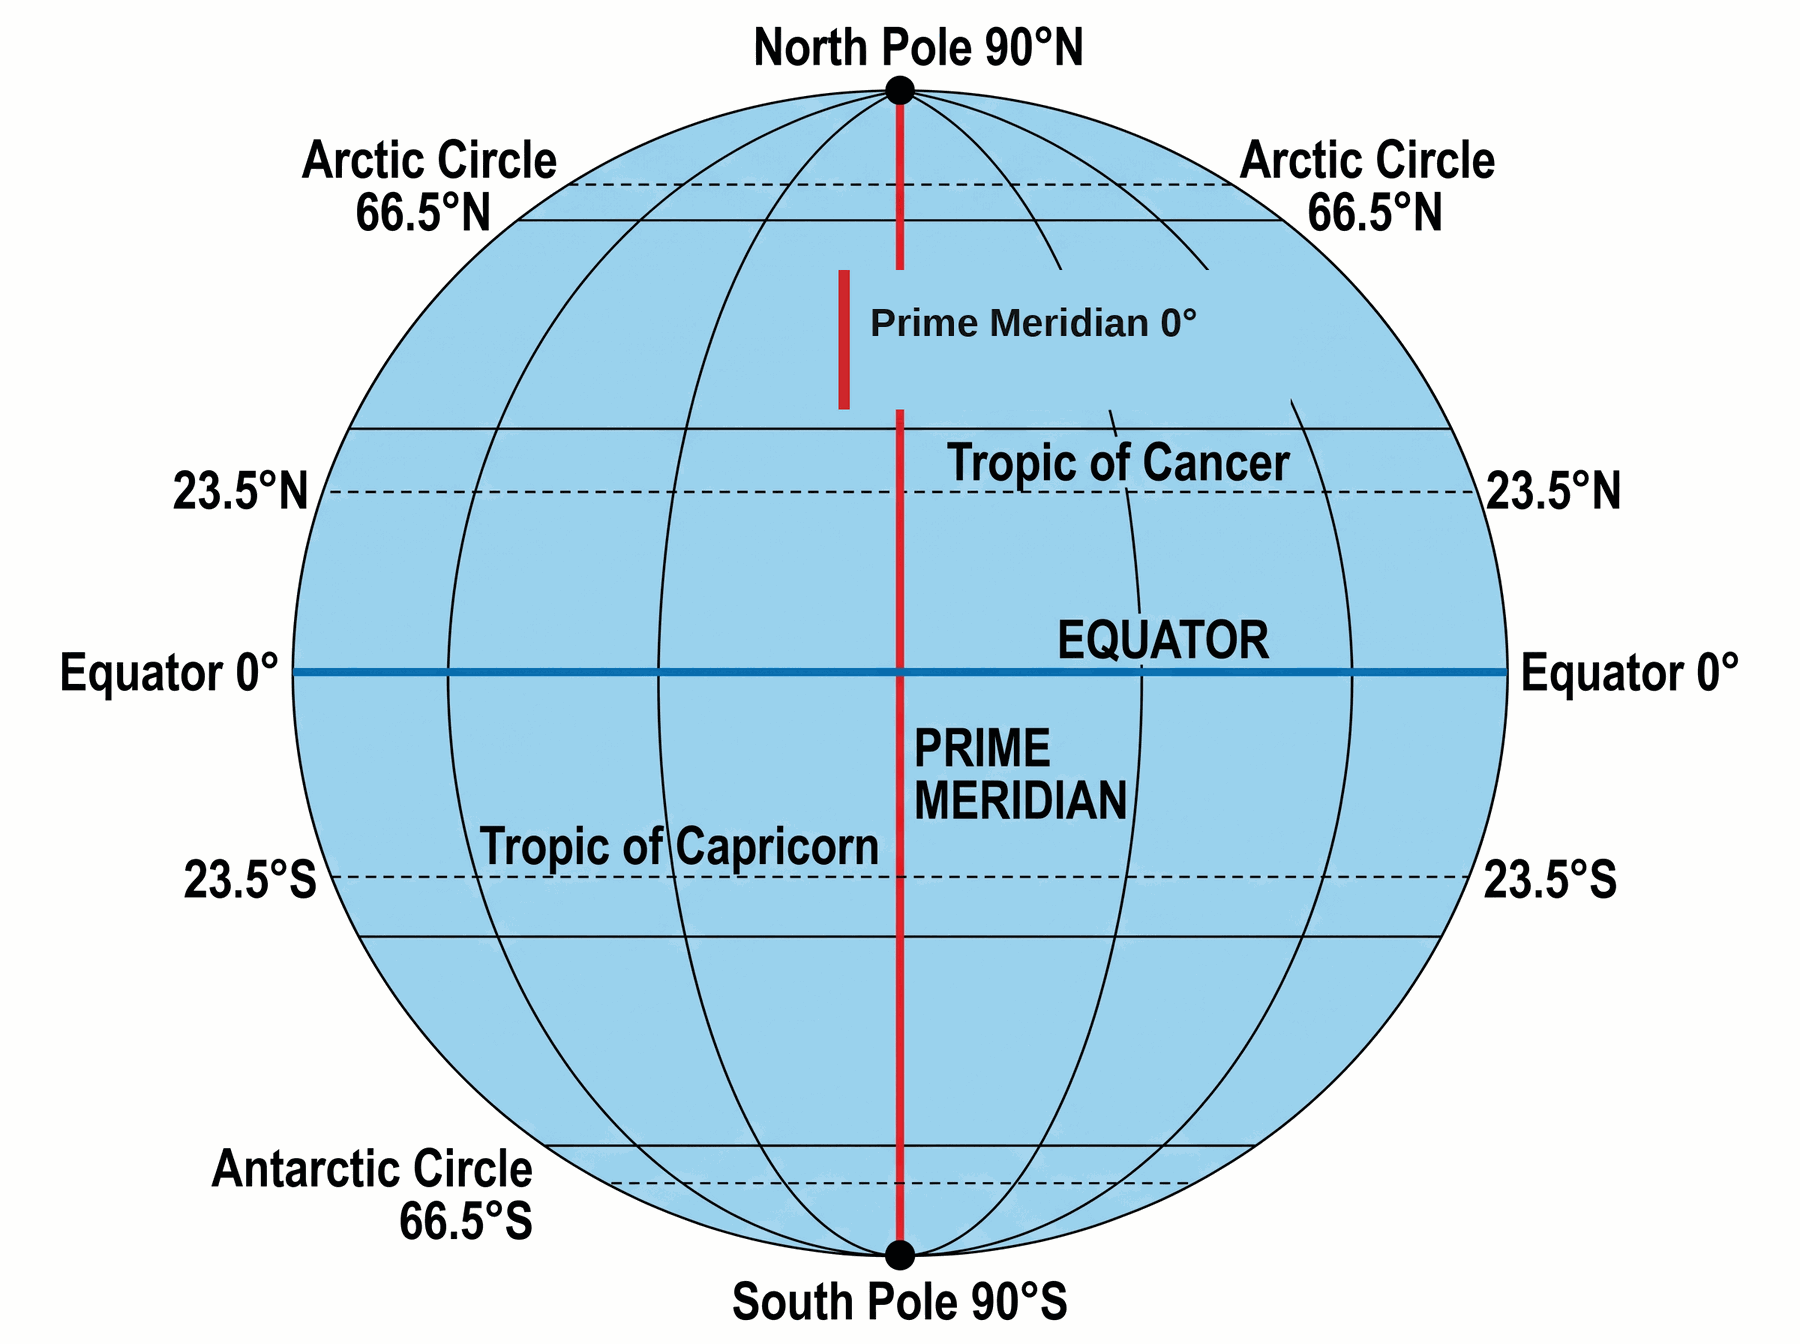
Latitude is north or south of the equator (the middle belt, 0°). Longitude is east or west of the prime meridian (the chosen zero line, through Greenwich). A point is where one latitude line crosses one longitude line. The course example: 30° N, 90° W is New Orleans.
4
The special lines are just named latitude lines
The tropics sit at about 23.5° north and south. That is where the sun can be straight overhead. The polar circles sit at about 66.5° north and south. That is where you can get a 24-hour day or a 24-hour night. You do not have to love astronomy. You do have to put the northern names north of the equator, and the southern names south.
Watch someone else explain it
Why all world maps are wrong — Vox — About six minutes. Shows why a globe cannot become a flat map without stretching something. Your lesson calls that a projection. Skip any extra names you have not learned yet.
Quick check — answer out loud before you peek
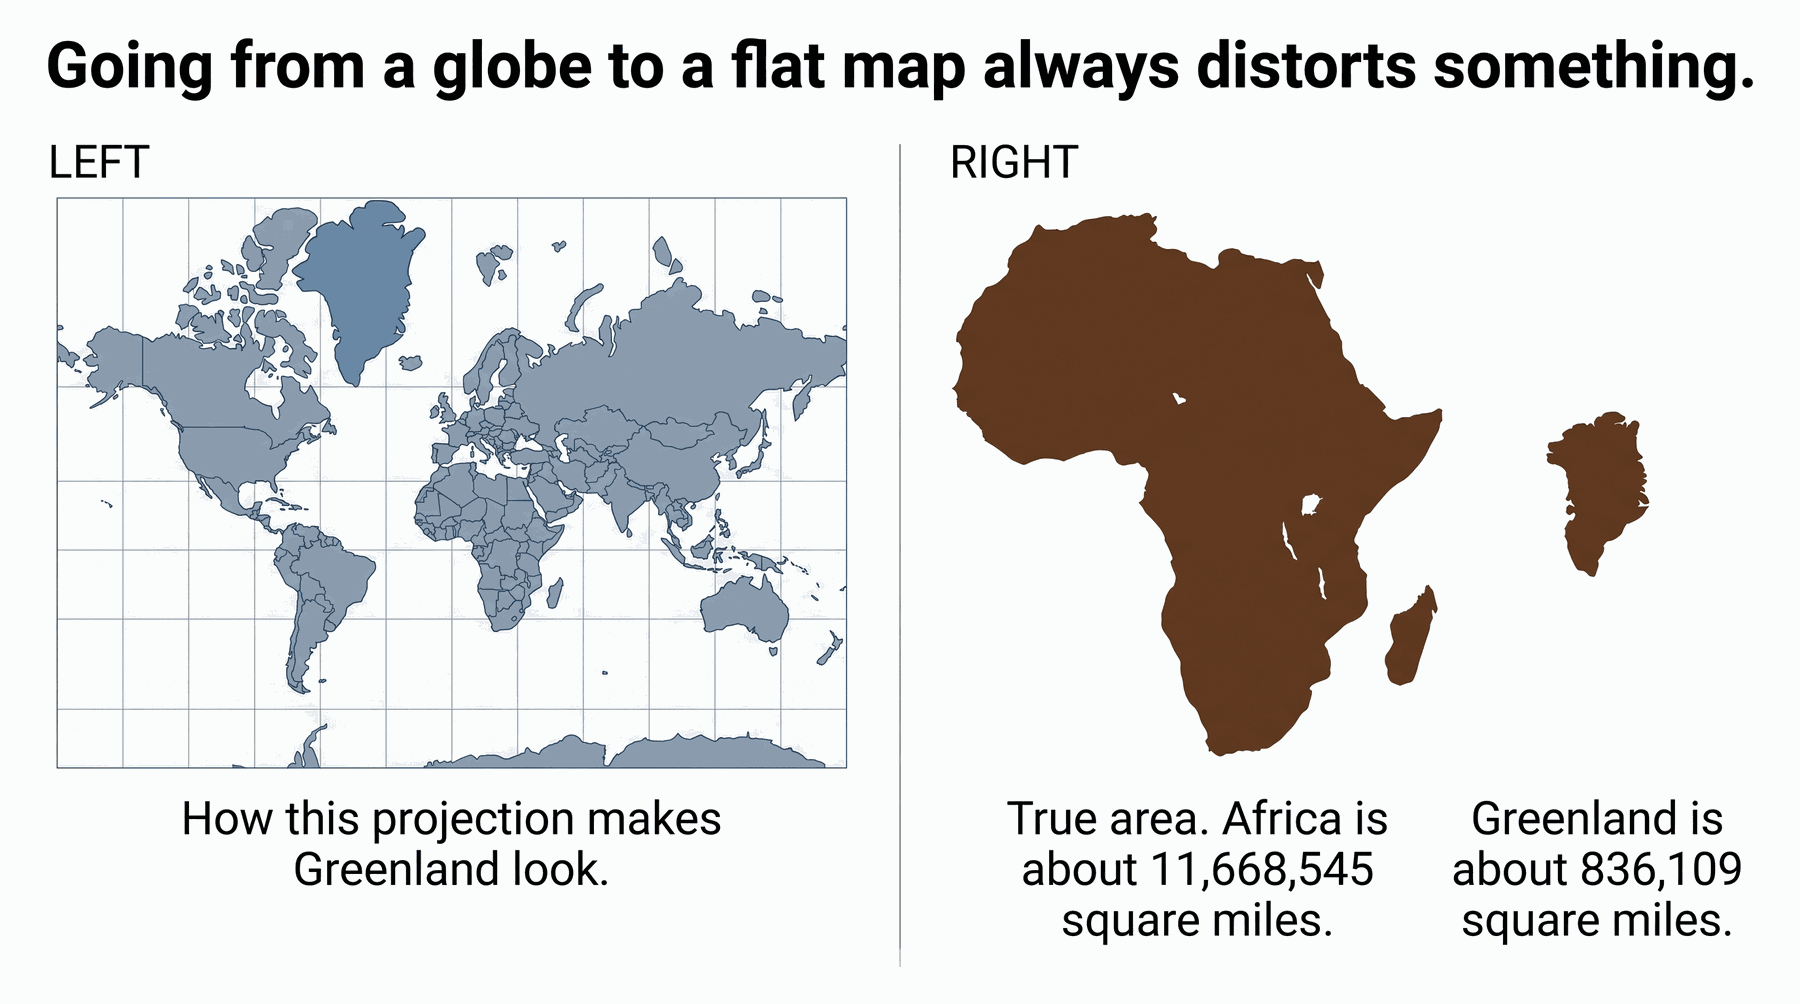
Someone shows you a world map where Greenland looks as big as Africa. What went wrong, the globe, or the picture of the globe?
The picture. Africa is about 14 times the area of Greenland (the course numbers: about 11.7 million square miles vs about 836,000). A cylindrical map stretched the land near the poles. The Earth did not change.
Got it now? Scroll back up and re-read the section — it should land differently.
A map is a picture of the world
Try this. Look out a window. Then look up the same street on a map.
A map is a picture of the world (2)
The window is full of extra information: weather, people, the color of a neighbor's car. A map leaves most of that out so you can focus on what you need. A map can also show things the window never will: country borders, history, how many people live there.
A map is a picture of the world (3)
That is the whole point of this study. A map is a picture of the world. Nothing more, and nothing less. Cartography is the name for making those pictures.
Likely on the quizIf a question asks what a map is, use the course's own sentence: a picture of the world. Compared with looking out a window, a map drops most information on purpose.
Four questions before anyone draws
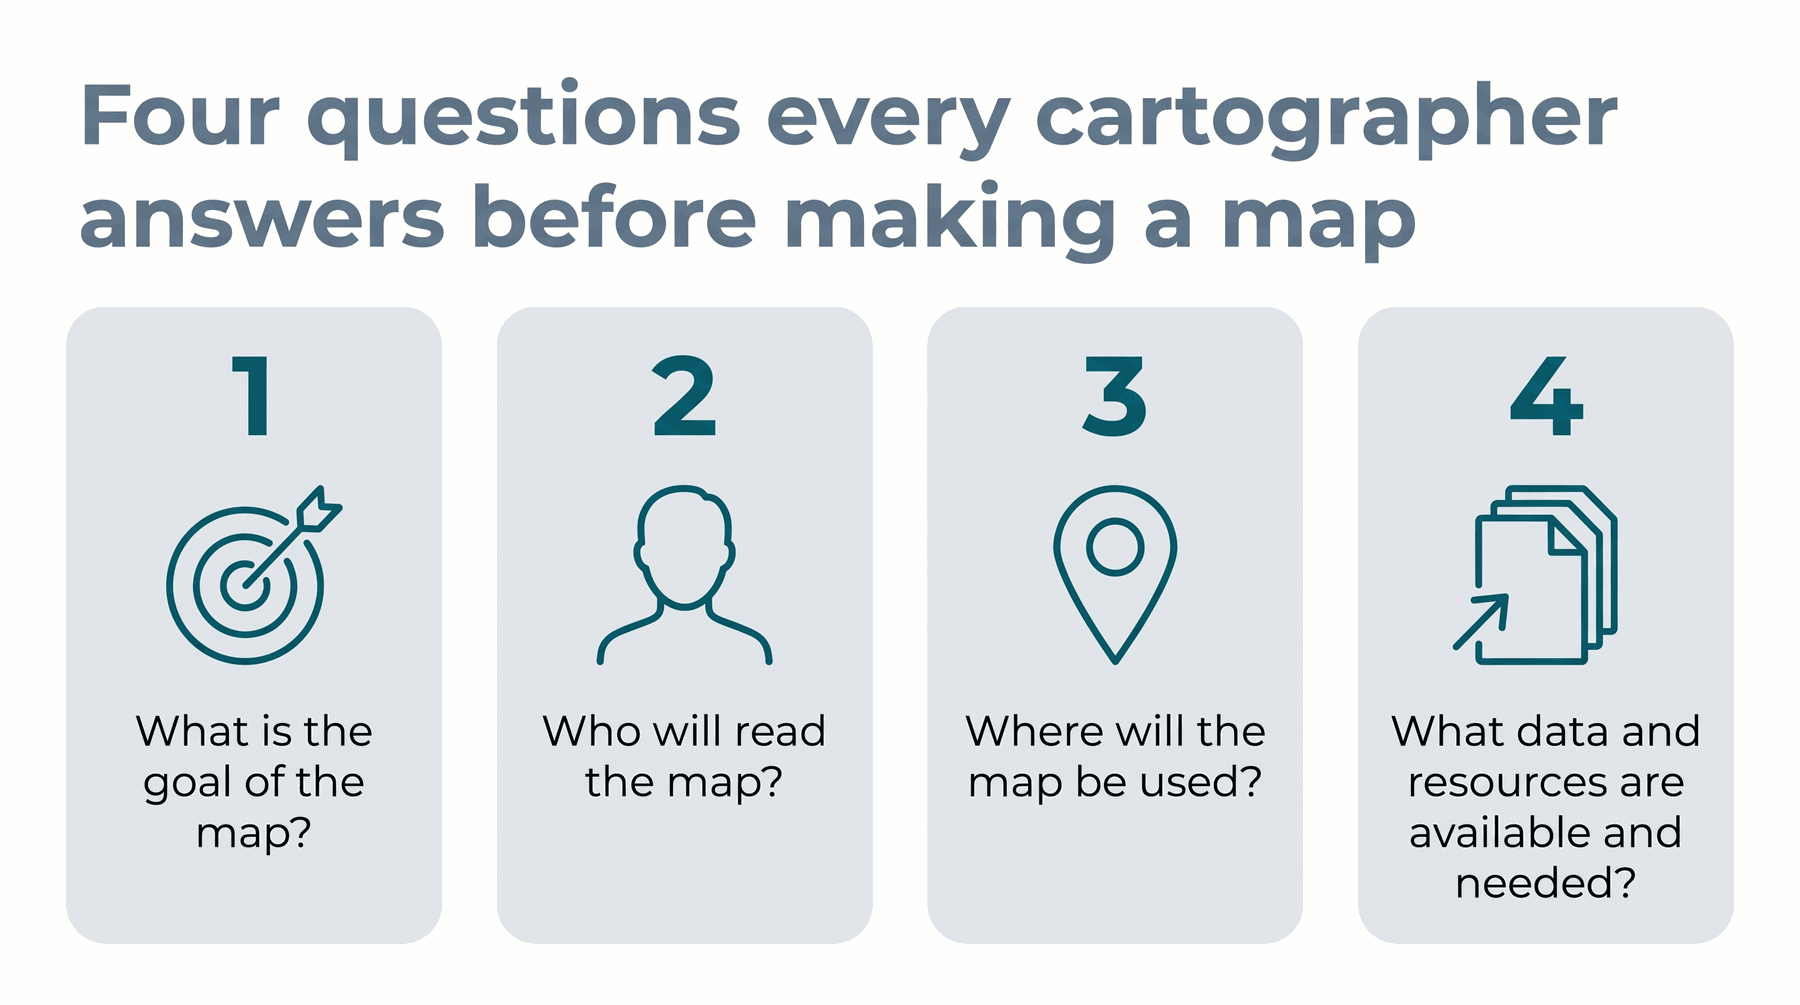
The slide show on page 2 is the same four questions you already met in 1.2.2. Making a map is visual communication, so the mapmaker has to know the answers.
Four questions before anyone draws (2)
1. What is the goal? Is this map just to show where things are, or is it trying to change how people feel? One example in the lesson is a map made to raise awareness about AIDS in Africa. 2. Who will read it? A map for experts is set up differently from a map for a textbook or a news magazine. 3. Where will it be used? A classroom wall, a pamphlet, a magazine, an atlas. The place changes both the look and what fits. 4. What data and tools are available? Mapmakers do not have unlimited time or money. The last slide is a map made in a few minutes with a website, a printer, and a highlighter.
The same four questions from 1.2.2. 1.3.1 asks them again because they apply to every map you will meet in this unit.
Likely on the quizLearn the four in order: goal, audience, place of use, data available. Cost is not one of them.
Hierarchy and balance
Your study sheet asks what a mapmaker means by these two words. They are design rules. They are about how the map looks, not about politics.
Hierarchy and balance (2)
Hierarchy means the most important parts stand out. They get better positions and more space. On the London subway map in the lesson, the stations where you change trains are the big circles. Those are the parts you need to notice first.
Hierarchy and balance (3)
Balance means spread things out. Do not pack one corner full and leave the rest empty. Maps that skip these rules are harder to read.
Likely on the quizStudy sheet Q2: hierarchy = importance, size, and position. Balance = an even layout in the frame.
How to actually read a map
The Mount Olympus animation walks through the parts in the order you should use them.
How to actually read a map (2)
• Title — "Physical Geography" tells you this map is about land, not countries. • Legend — colors for elevation (how high the land is). Dark brown is highest (5,000–10,000 feet), so Olympus must be a mountain. • Scale — how far from Nicosia to Olympus. • Compass — Nicosia is northeast of Olympus.
How to actually read a map (3)
Then the lesson gives you a U.S. precipitation map (average rainfall and snowfall, 1961–1990) so you can practice. Same four tools: title, legend, scale, compass.
Likely on the quizIf a question describes using a map to plan a trip, the order in the animation is the expected order: title → legend → scale → compass.
The six kinds of map
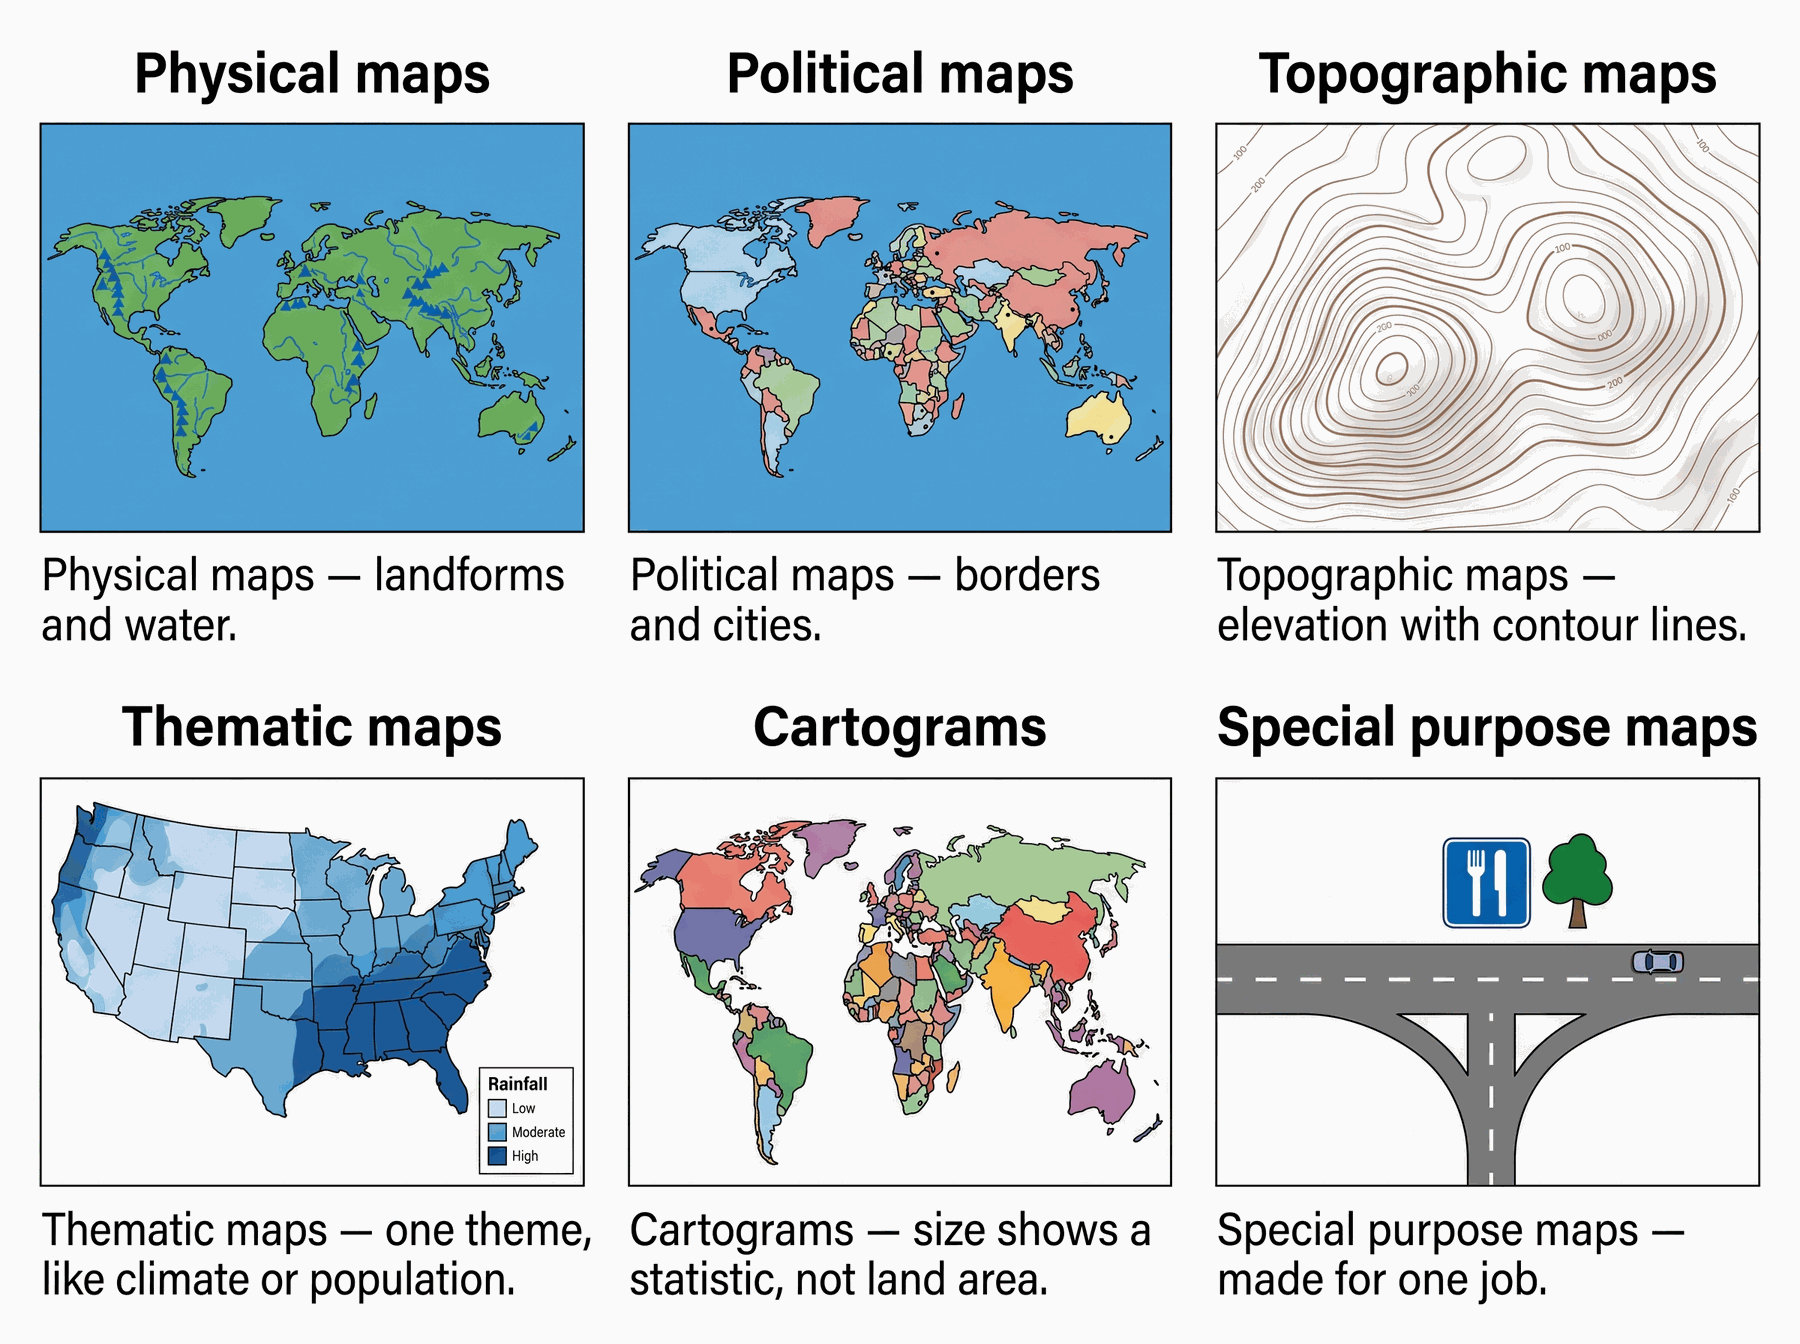
Your study sheet asks you to describe each of these. The page-8 slide show is the source.
The six kinds of map (2)
• Physical maps — landforms and water. • Political maps — human boundaries: countries, states, cities. • Topographic maps — the shape of the land, usually with contour lines. • Thematic maps — one theme (climate, population, rainfall). The precipitation map on page 7 is this kind. • Cartograms — places resized by a number, not by land area. Size might mean people, money, or votes. • Special purpose maps — built for one job: roads, weather, trails.
The six kinds of map (3)
Picking the right map for the job is itself a map-reading skill. A world map will not get you from James Street to Washington Avenue. Lesson 1.3.5 will call that validity: did the map do the job it was made for?
The six types on your study sheet. Match the picture to the job, not the other way around.
Likely on the quizIf a question mentions contour lines, the answer is topographic. If it resizes countries by people or money, it is a cartogram, not a thematic map.
Round Earth, flat paper
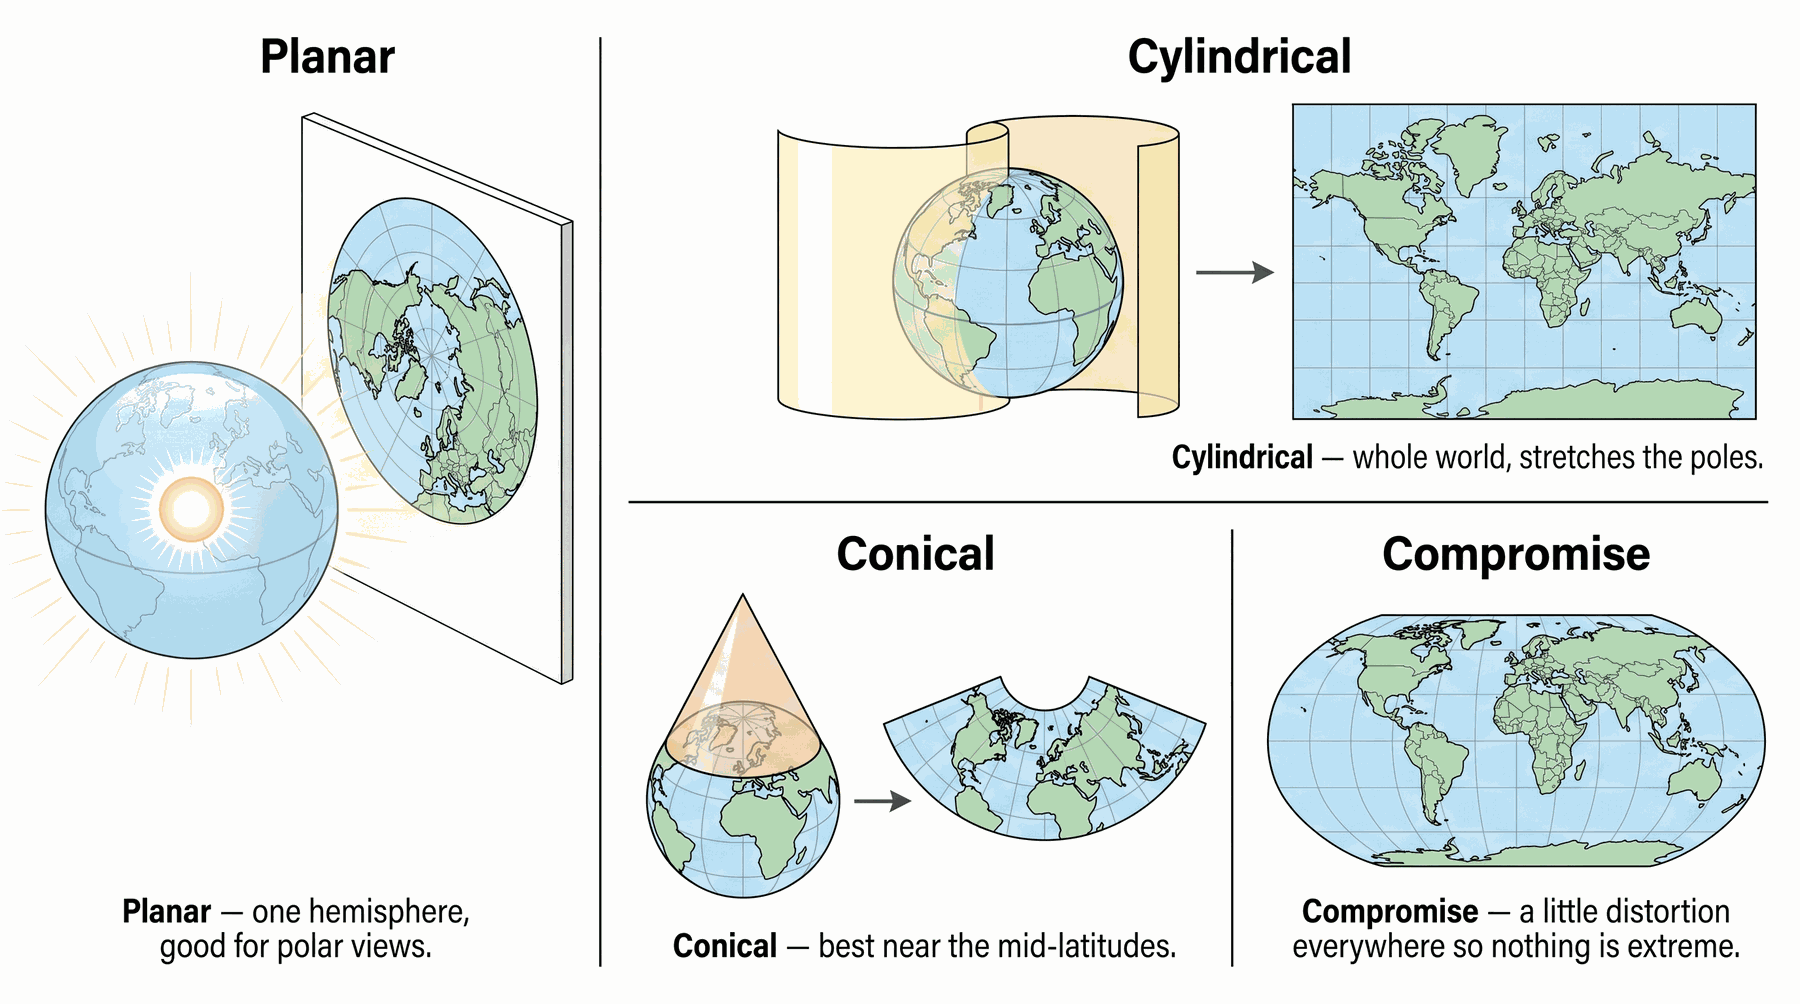
The Earth is round. Paper is flat. The lesson uses an orange to show the problem. A photo of an orange leaves out the back. Peeling it and laying it flat makes the peel try to spring back. Tearing it into a square is even more misleading.
Round Earth, flat paper (2)
Mapmakers meet that problem with a map projection: a method for drawing the curved Earth on a flat page. The animation's picture is a glass globe with a light in the center. Land painted on the globe casts shadows onto a surface. Real mapmakers use math, not lightbulbs, but the idea is the same.
Round Earth, flat paper (3)
There is no perfect projection. The lesson's example: on a common rectangular map, Greenland looks as big as Africa. In reality Africa is about 11,668,545 square miles and Greenland is about 836,109. Africa is about fourteen times bigger. The scale grid on that map is how you correct the visual lie: one inch at the top of the map stands for fewer miles than one inch in the middle.
The course's own numbers. If a quiz shows Greenland looking huge, it is talking about this kind of stretching, usually on a cylindrical map.
Likely on the quizHold the numbers: Africa is about 14 times the area of Greenland. "Looks the same size on the map" is the stretching, not the fact.
Four families of projection
The study sheet asks you to describe each family and give a benefit and a drawback. The animation on page 11 gives planar and cylindrical in full. Conical and compromise are on the study sheet.
Four families of projection (2)
• Planar — shadows onto a flat wall. Benefit: good for one hemisphere, especially looking down on a pole. Drawback: leaves out the half of the globe pointing the other way. • Cylindrical — paper wrapped around the globe as a tube, then unrolled. Benefit: the whole world on one sheet; useful for navigation. Drawback: stretches area near the poles (that Greenland trick). • Conical — a cone over the globe. Benefit: lowest stretching in the mid-latitudes the cone was fitted to. Drawback: worse as you move away from that band; not a natural whole-world view. • Compromise — stretches a little of everything so nothing is extreme. Robinson-style oval world maps live here. Benefit: looks right for a wall map. Drawback: no single property (area, shape, distance, direction) is perfectly true.
Four families of projection (3)
The lesson's conclusion: there is a place in the world for nearly every projection. The best one depends on the purpose of the map.
The four families on the study sheet. Purpose picks the projection, not the other way around.
Likely on the quizIf the question is "why isn't there one best world map?" the answer is: going from 3-D to 2-D always stretches something, and different jobs need different properties kept true.
Not sure about this bit?
Four names. Each one is a different way to flatten the globe onto paper.
1
Planar — paper is a wall
Imagine a light in the middle of a glass globe, and a flat wall next to it. The shadows make a map of one half of the Earth. Polar maps work this way. The back of the planet is missing.
2
Cylindrical — paper is a tube
Wrap the paper around the globe, then unroll it. You get the whole world. Land near the poles stretches. Greenland looks huge.
3
Conical — paper is a cone
Set a cone on the globe, then unroll it into a fan. It is most accurate in the middle latitudes the cone was fitted to, like much of the United States.
4
Compromise — a little stretch everywhere
Change a bit of everything so nothing looks extreme. The oval Robinson-style world maps live here. They look like the Earth you have in your head, but no one measurement is perfect.
Quick check — answer out loud before you peek
You need a map of Arctic shipping routes, looking down on the North Pole. Which family?
Planar. One hemisphere, pole in the middle. A cylindrical world map would squash the Arctic into a stretched strip along the top.
Got it now? Scroll back up and re-read the section — it should land differently.
Latitude, longitude, and the chronometer
Latitude is how far north or south you are from the equator. Sailors could already find it with an astrolabe or sextant: measure a star against the horizon.
Latitude, longitude, and the chronometer (2)
Longitude is how far east or west you are from the prime meridian. That was the hard problem. Navigators could tell local noon (sun straight overhead). If they also knew the time at a known place, the difference told them how far east or west they were. They needed a clock that kept time on a rocking, humid, hot-and-cold ship. Pendulum clocks could not.
Latitude, longitude, and the chronometer (3)
Britain offered a prize of 20,000 pounds, about half a million dollars today. John Harrison, a working-class carpenter, invented and perfected the first accurate seafaring chronometer. That is why the chronometer shows up on your study sheet.
Likely on the quizStudy sheet Q5: the chronometer mattered because longitude needs a comparison of local time with time at a known meridian. Latitude did not need that clock. GPS still uses this same grid. It just reads it from satellites.
Latitude and longitude, like a graph
A GPS reading is two numbers: latitude and longitude. Treat them like a graph. The origin, where both are zero, is the crossing of the equator and the prime meridian. Every position is north or south, and east or west, of that crossing.
Latitude and longitude, like a graph (2)
The lesson's example: 30° N, 90° W is on the southern coast of Louisiana. That is New Orleans. It is still that point on a map with curved lines. The grid works on every projection.
Latitude and longitude, like a graph (3)
The equator is naturally in the middle of the poles. Longitude has no natural zero, so a conference of geographers in 1884 put 0° through the Royal Observatory in Greenwich, England.
Latitude and longitude, like a graph (4)
Four more special lines, from the sun: • Tropic of Cancer ~23.5° N — farthest north the sun is straight overhead, June solstice. • Tropic of Capricorn ~23.5° S — farthest south the sun is straight overhead, December solstice. • Arctic Circle ~66.5° N and Antarctic Circle ~66.5° S — outer limits of 24-hour polar day and polar night.
Latitude and longitude, like a graph (5)
Memory tricks from the lesson: latitude lines get shorter toward the poles. Longitude lines are all the same length. In football, a lateral pass goes to the side. Latitude lines also go side to side.
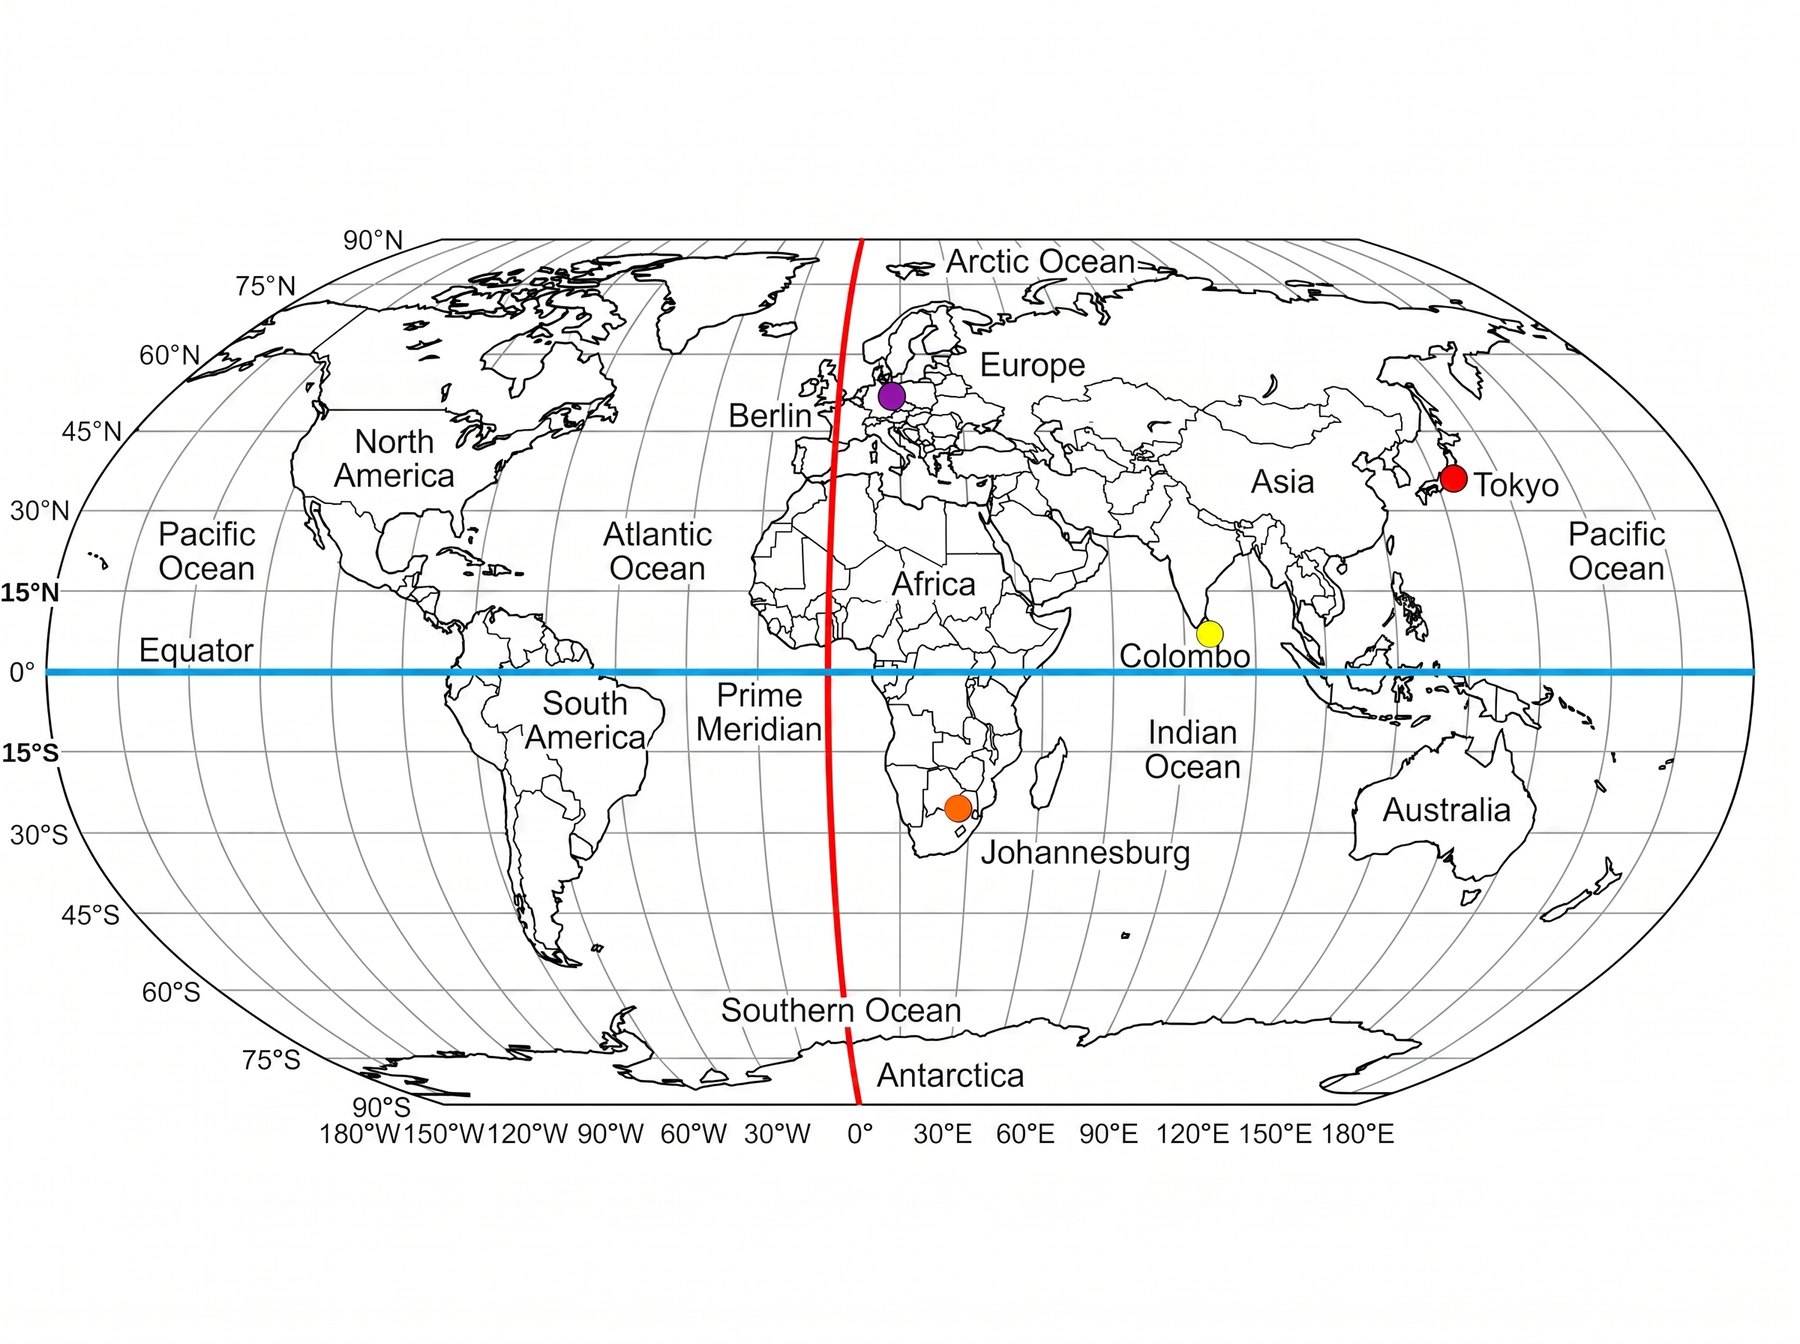
Study sheet Q6 asks you to label these six lines. Equator and prime meridian plus the four sun-circles.A numbered Robinson grid with the same four cities as the 1.3.2 practice. Latitude first (the rings / the horizontal), then longitude.
Likely on the quizPlot order from 1.3.1 page 17: find the latitude line first, then the longitude line, mark the crossing. 30° N 90° W = New Orleans is the course's own check that you did it right.
Not sure about this bit?
Two numbers. Same move every time: find latitude first, then longitude, then mark the crossing.
1
Find 0, 0 in your head
The equator (0° latitude) crosses the prime meridian (0° longitude) in the Gulf of Guinea, off west Africa. Every other place is north or south, and east or west, of that crossing.
2
The course check
30° N, 90° W. That is the southern coast of Louisiana: New Orleans. If you land in the Gulf of Mexico or in Canada, you swapped north/south or mixed up 30 with 90.
3
The six special lines for the study sheet
Equator. Prime meridian. Tropic of Cancer (north). Tropic of Capricorn (south). Arctic Circle (north). Antarctic Circle (south). Cancer and Arctic are north. Capricorn and Antarctic are south.
Quick check — answer out loud before you peek
Tokyo is about 36° N, 140° E. Do you go north or south of the equator first?
North. Latitude first: find 36° N (between 30 and 45, in Japan). Then 140° E (between 120 and 150). The crossing is the city.
Got it now? Scroll back up and re-read the section — it should land differently.